Users leaving negative reviews in the App Stores may very well be the beginning of doomsday downward spiral for a mobile app.
As an app owner, you are wondering what just happened. You could see some harsh reviews, chatter about app crashes, some saying the new app is draining device resources or slowing down their device. Your number of downloads, retention and engagement metrics takes a hit.
Mobile apps release process goes through a rigorous continuous-integration lifecycle, which can be complex & resource intensive. There are many SDKs to validate & maintain, APIs access and enterprise security policies to incorporate, enterprise app stakeholders are especially more concerned about security, stability, predictability and scaling down the costs of mobile development and maintenance. QA testing is also not easy either, when it comes to mobile application lifecycle across the plethora of devices and OS mix. The native-vs-hybrid in consumer-vs-enterprise world comes with its own deployment & integration challenges.
Houston we have a problem!!
Indeed it is. So let’s unpack some of these challenges one at a time. To begin with, what you need is an intelligent mobile monitoring strategy around real-time performance insights, health & availability metrics from mobile end user’s perspective. There is an immediate need to collect real-time feedback that reduces the time to identify & resolve any end users issues & the scope of impact.
Developers live and die by making great software that people enjoy using. Typically when they are confronted with such app issues, the first thing they look for is collecting crashes stats & performance logs about the performance of the backend infrastructure, either in the cloud or hosted inside the data center.
Crashes are definitely one of the most frequent reason for those dreaded one star reviews. It’s a downward spiral - the more crashes your users reports, the more one star negative review you will accumulate & less chances of any new users download. Not an ideal situation to be in. Other reasons may be around transactions aborted or timeouts.
In the last few years the industry has seen some niche tools addressing these challenges. But is there one solution that provides all the key information with one SDK? One that can provide a holistic view of not only performance insights but also provides detail user analytics as well as adheres to enterprise security policies?
Yes there is. With CA Mobile App Analytics (MAA) solution, you have all the KPIs at your fingertips to address these performance challenges as well as user analytics. CA MAA provides that 360° degree performance views that helps in understanding the complete mobile app user experience across the entire application lifecycle.
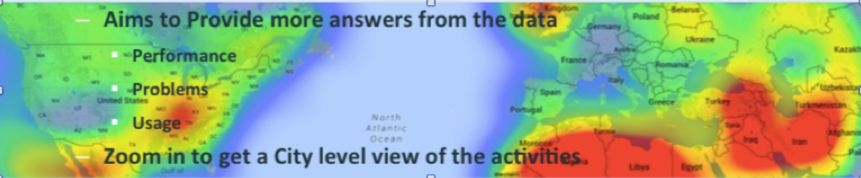
CA MAA provides complete visibility on user and usability experience plus performance and crash analytics with full context to app versions and all of that in a single dashboard. CA MAA usage analytics dashboard will provide you information like how the users are adopting your application. GeoMaps allows you to quickly see where the users are coming from, how much time they are spending inside the app & if they are returning users. It can also predict based on the trend analytics, possible problems that you may not be aware of, like app startup time or network latency increased in the new release.

You can see the performance of your app in geo heatmaps which provides visual representation of raw data that takes the guesswork out of the analysis. Are we seeing performance issues in only one city, or country level view of activities?
In CA MAA, deep dive views are one click away to measure the API performance, transaction failure rates & their average latency-even the type of network calls being made, all the way to the line of code with failed session analytics including symbolicated stack traces.
A developer can see exactly what transpired on the enduser session, what the user viewed and the specific actions they took on each screen- essentially a simulated video playback of specific events, with the ability to step through events all the way leading up to the crash. This information is GOLD for a developer and for the OPS team as well.

Device performance can sometimes play an important role in the health & stability of your app. Samsung S6 early adopters are complaining about device RAM management issues causing all sorts of problems for the apps. If your app is being monitored by CA MAA, it will capture device performance metrics in context of your app crash so that you can not only see device related KPIs but also how the network latency affected your app performance. Drilling down into errors to see what was happening on the device at the time of the crash, what geography the user was in, what was the battery level and how many applications were loaded into memory at the time crash is also just one click away in MAA.
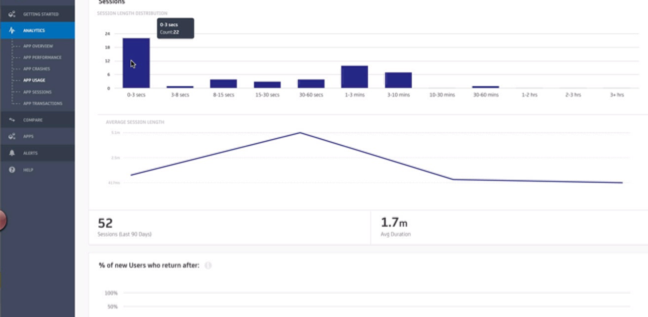
User retention & engagement metrics are additional critical health metrics to measure. An upward trend in the usage is a good sign of user engagement. MAA provides detail session analysis that gives you the insight into the breakdown of user sessions and how long the users were engaged.
If you the owner of any retail, healthcare, insurance or financial apps, "Security" is obviously one of the key sticking points. MAA SDK enhanced security now gives you the option to enable end-to-end data encryption whether it is data at-rest, data in-flight or cached data. All the data transmission between the SDK & MAA server is over SSL, to prevent any man-in-middle attacks. And yes the libraries used in MAA server side are FIPS compliant.
In MAA, you can compare the performance of your app by historical baseline & report across multiple dimensions including by device, OS, app version, by carrier, platform, network, location & by any custom events. Measuring the performance as well as user adoption of your new app version against an older one can be done side by side.
But wait, there is one more thing. What happens when a critical mobile transaction SLA is breached? What if the backend infrastructure could have caused some of these issues? CA MAA now integrates with CA APM 9.7 Java agents. This integration will help developers & operations teams to collect mobile transaction traces all the way back to your Java Apps Server

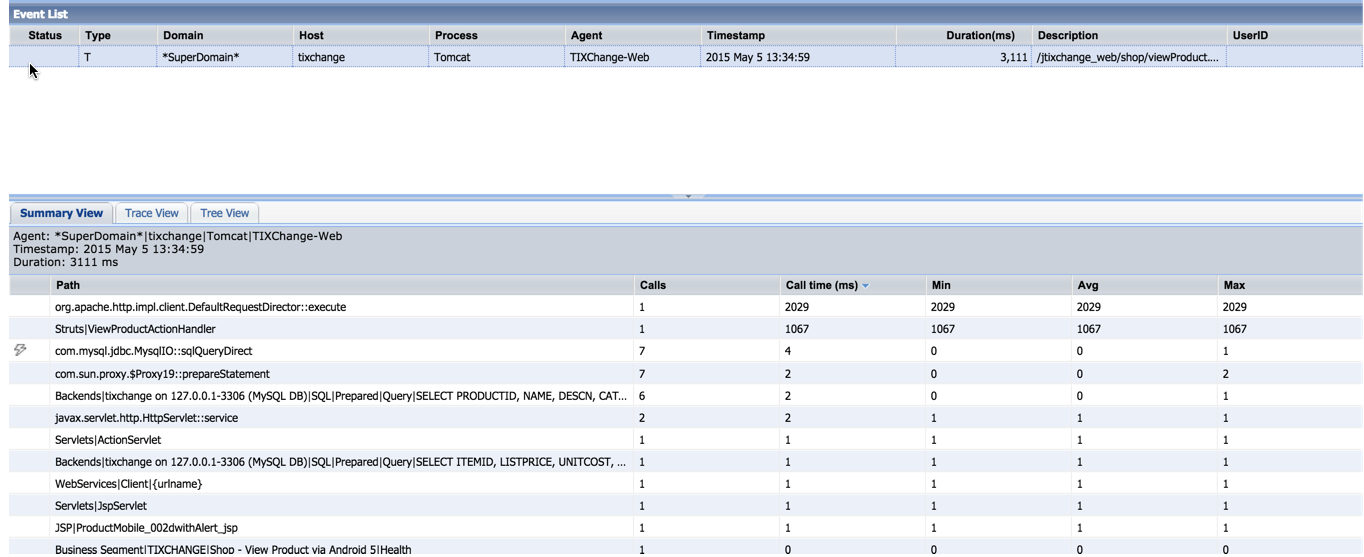
DevOps engineer can quickly triage these slow mobile transactions problems right from CA MAA console into CA APM transaction trace views. CA APM provides you cross process trace views when the transaction hops from tier to tier, down to the SQL level.

With CA APM 9.7 AppMaps & smart instrumentation capability, DEVOPS engineers can triage & diagnose the root cause immediately. No need to call your server team & request serverside logs. Smart Instrumentation provides deep transaction traces of the application code performance details from the device all the way to the backend servers.
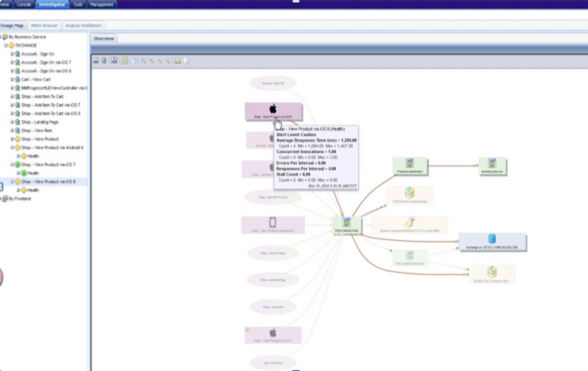
This MAA to APM 9.7 integration allows you to have a mobile context aware Triage Maps in APM. IT operations teams can easily investigate where issues reside across end-to-end mobile app infrastructure. This MAA-APM integration is the first step we have taken towards CA’s vision of tracing transactions from mobile to mainframe and there is much much more in the roadmap to come. And last but not least, you know what is the best part? All of the above is available to you with a single SDK footprint. Performance, Security, User Analytics, Session Playback, all in one. And there is much more coming.
We have great plans & roadmap direction for CA APM. With APM 9.7, we have introduced our E.P.I.C APM strategy to stimulate loyalty and differentiate our client’s business in the app economy. Our journey has already begun.
Customers can review the new feature of MAA here & download a free trial from here