Banana is fork of Kibana, data visualisation plugin for Elasticsearch. Banana works with almost all kinds of time series and non-time series data stored in Apache Solr. It ports key panels to work with Solr, provides significant additional capabilities. This blog is to describe process of configuring and using banana dashboard.
Pre-requisites:
- Access to CAMAA Web Tier System
- Access to Solr WebApps Directory
- Banana Libraries
Installation
- Banana is open-source plugin and can be downloaded at Lucidworks github.
- Extract downloaded libraries to CAMAA WebApps Directory.
($CA_EMM_HOME/DSE.x.x/resources/solr/web)
- Thats all!, you just installed banana plugin. Now go ahead and open browser and type below address:
http://localhost:8983/banana/src/index.html#/dashboard(you can choose to replace localhost with hostname)
- Browser pop-up will ask for credentials. Provide same SolrAdmin Credentials (U:camdo/ P: camdocas)
- You should see this dashboard

- You are seeing this error because we haven't configured dashboard yet.
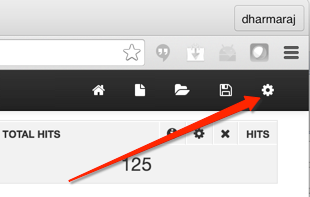
- On top-right corner of browser, close the alert, and click on settings icon.
- A new pop-up window will appear, to choose settings. Click on Solr Tab.

- In Collections parameter, start to type maa, you will see already stored collections. (this is because banana is able to communicate with solr server) Select a collection, which has got maximum data.

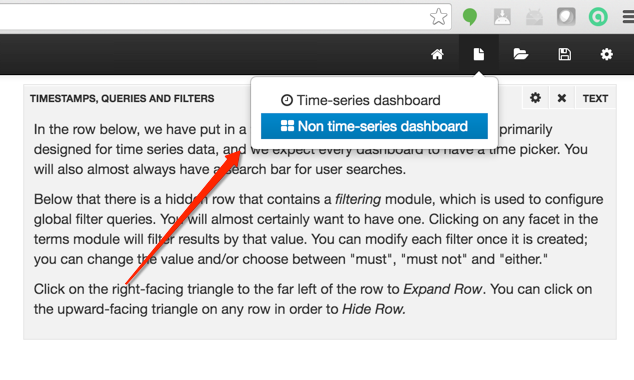
- On top-right corner of window, click on New and then Non-Time-Series Dashboard.
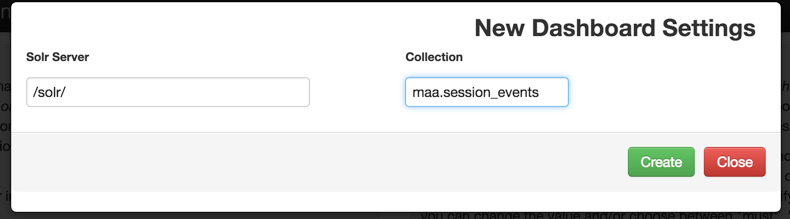
- That will load dashboard settings. In 'Collection' parameter, provide a name for collection and click on create.
- Once you load collection, you should see total hits on top-right corner.

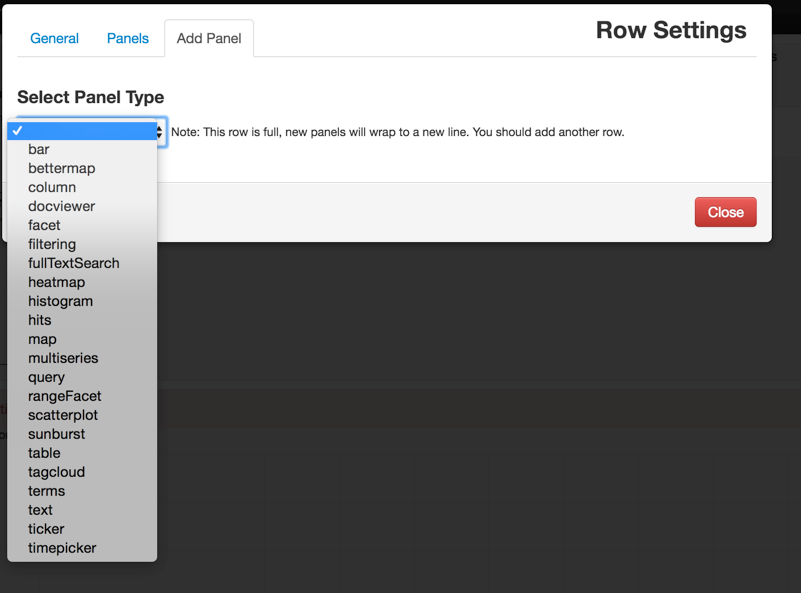
- Now, you can choose to define panels, configure rows. On left corner of dashboards, you should see multiple settings icon, click on that to add desired panels and rows. Click on Configure row

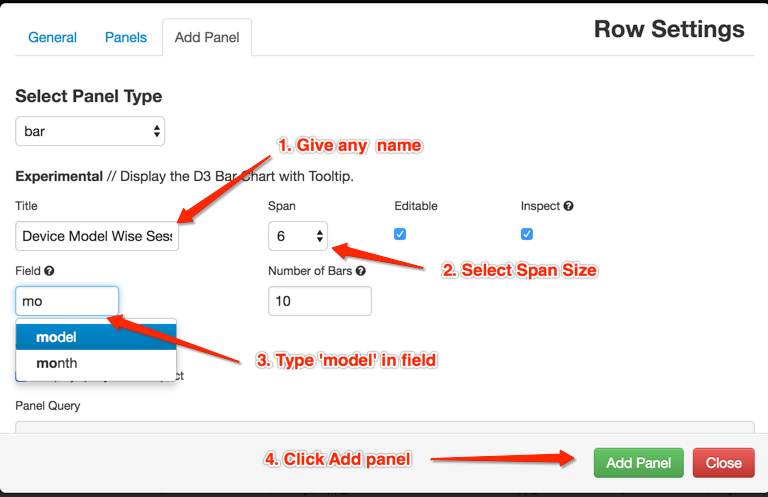
- Go to 'Add Panel' tab end select 'bar' panel type.
- Provide configuration and click Add Panel
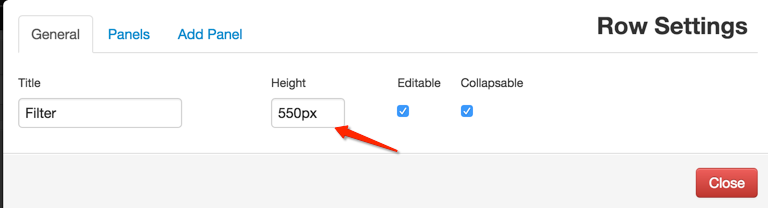
- Change panel height to required number. In my case, I made it to 550px. Click on Close.
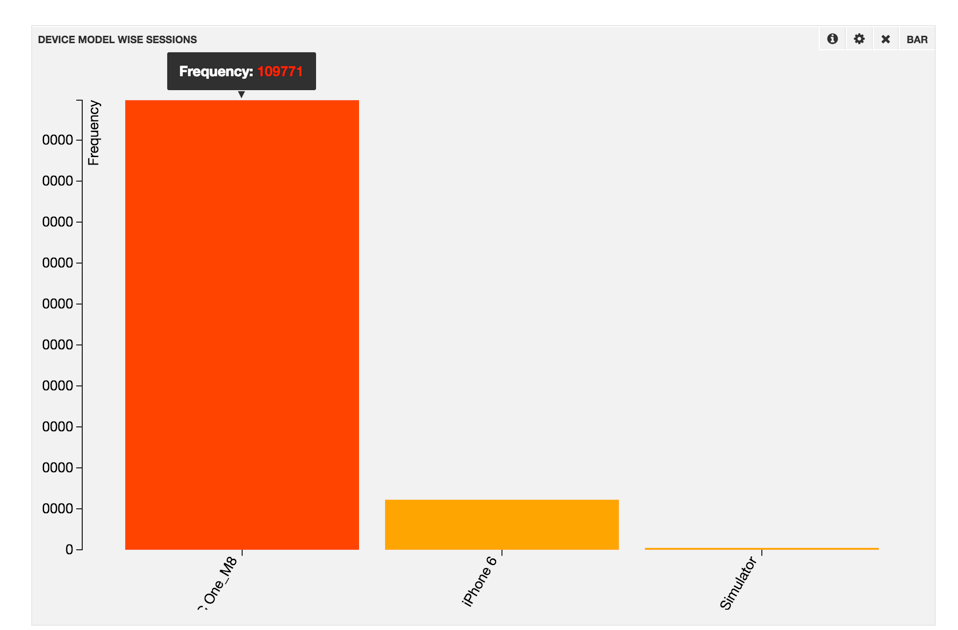
- Above settings should load Bar showing 'Model wise sessions'
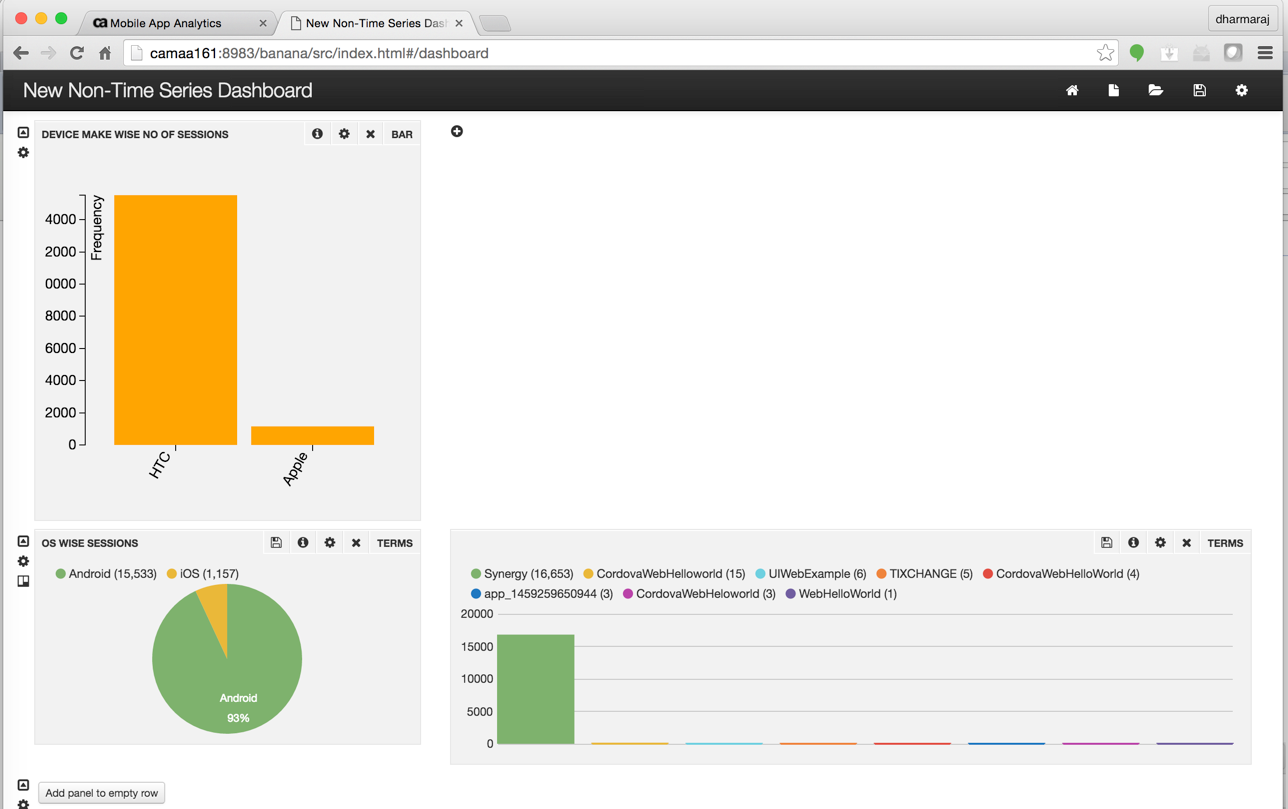
- Same way, you can add multiple panels, to your dasboards
- Don't forget to save your settings, else, you need to perform all steps again to configure dashboard.

You can export dashboard settings to file or set current dashboard as a default one.