Note: We'll be at AWS Summit San Francisco on April 4th! We'll have our own booth there, so if you can please come and find us (the event is free!) and we'd love to chat with you.
CA APM is an Application Performance Management solution that can help teams gain performance insights and diagnose issues across the full software lifecycle. It includes transaction tracing that supports modern APIs and apps, and it can help teams get to the root cause of bugs in APIs, transactions, code and database calls.
Runscope is an API monitoring solution that ensures that a web service API in a mobile or web application is as reliable as code running locally or in production. Runscope customers configure API monitoring tests for both test and production and can ensure that their APIs are up, performing well, and returning the correct data.
CA APM can monitor and record the details of API responses while they’re being handled in the data center or cloud. By connecting CA APM with Runscope API monitoring, you can get a full picture and find the root cause of why an API is slow or failing.
Watch the following video to learn how to set up the Runscope and CA APM integration, or follow the step-by-step instructions below:
Connecting Runscope with CA APM
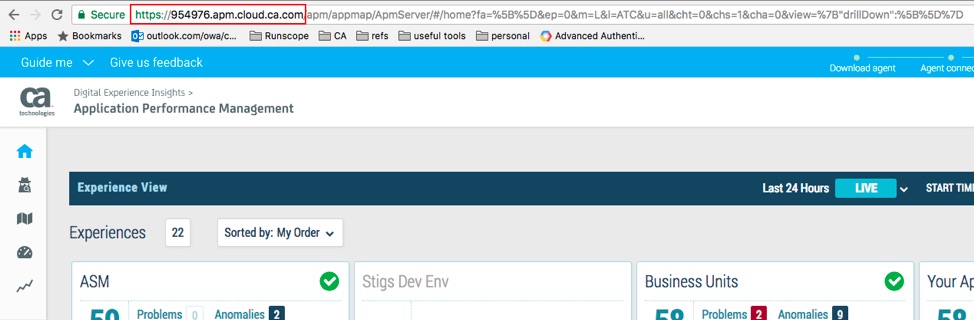
Go to your CA APM SaaS tenant and log in. After that, copy the url (without the path) that we’ll be using in the next steps. For example: https://954976.apm.cloud.ca.com
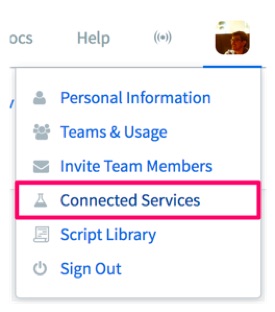
In your Runscope account, click on your profile on the top-right and select Connected Services:
Find the CA Technologies logo and click on Connect CA APM:

Paste the CA APM URL that we copied in the first step in the text field and click on Enable APM Traces:

And you’re all set! Next, we’ll look at how to start sending the API monitors information to our CA APM instance.
How to View an APM Trace
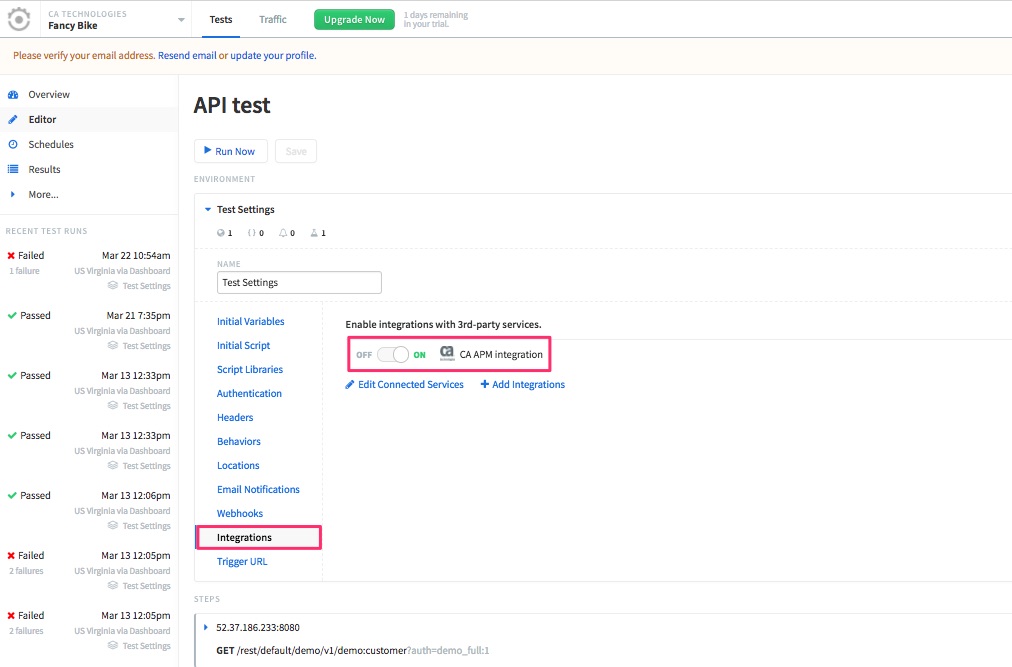
The first thing we need to do is enable our integration in our API monitor environment settings, to start sending information from Runscope to our CA APM instance:
- In your Runscope account, select a bucket and open an API monitor
- Select Editor on the left-hand side, and open the environment settings
- Open the Integrations tab in the environment settings and turn on the flag for the CA APM integration.
Now that the integration is enabled, we can click on Save & Run at the top. After the test is completed, open the result page under “Recent Test Runs”:

The first link at the top next to Trace, “View in CA APM” will show the metrics map for the entire test.
You can also expand each individual API request and select the “Connection” tab. You’ll find a Trace section under Timings with another “View in CA APM” link. Following that link will land you on the metric view for that specific request.
Root Cause Analysis with Runscope and APM
For in-context viewing of an APM trace, please make sure you have the correct “Universe” settings. You can use “All” if you haven’t created a Runscope-specific Universe.


If you need any help with your integration, check out our full docs and please reach out to our awesome support team!