Best practices to maintain the size of reporting database
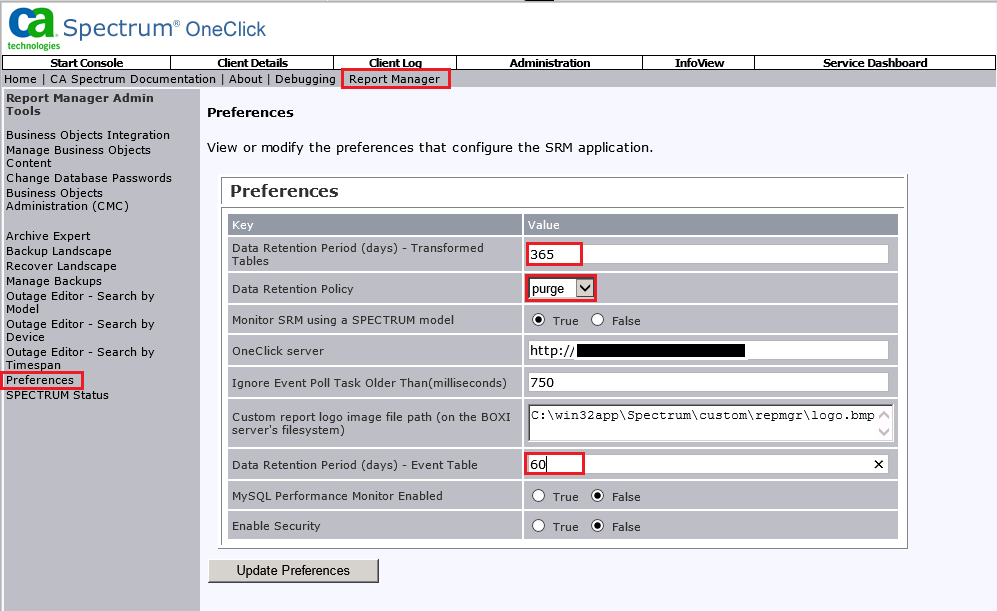
SRM Preferences setting
The 'Transformed tables' refers to all rapidly accumulating tables that contain information that is derived from events (for example, alarms, outages), You can set a higher value for this retention period such as 365 days.
The 'Event table' refers to the retention period for the event table specifically. This event table is one of the fastest growing tables, so you can set the retention period of this table individually. You can set to 60 days for this retention period. The event retention period is much smaller than the transformed retention period because the event table grows much faster than the other tables.
Filtering Event Processing
The Event processing filters make two things for you. Do you populate the reporting database with unwanted events, so the database will not grow faster and also reduce the load of SRM application, because it will not wast time processing those unwanted events.
Event processing filters are defined by an XML file that can exclude certain events from being loaded into the Report Manager database. Specifically, events that are associated with the event types or model handles that are listed in the event-processing-filter.xml filter file are not loaded into the Report Manager database.
Before you modify the supplied event-processing-filter.xml file, you can determine the event types and model handles for which event activity can be excluded. Excluded events are not available in Report Manager for historical reporting purposes.
How to determine the highest events counts by type
Query for highest event counts by type in the reporting database:
1) Open a bash shell (bash -login)
2) Go to $SPECROOT/mysql/bin directory
3) Run:
./mysql --defaults-file=../my-spectrum.cnf -uroot -proot reporting
4) Run the following MySQL command:
SELECT COUNT(*) AS cnt, HEX(e.type), d.title FROM event e INNER JOIN eventdesc d ON e.type=d.type GROUP BY e.type ORDER BY cnt DESC LIMIT 100;
Query for highest event counts by type in the DDMdb database:
1) Open a bash shell (bash -login)
2) Go to $SPECROOT/mysql/bin directory
3) Run:
./mysql --defaults-file=../my-spectrum.cnf -uroot -proot ddmdb
4) Run the following MySQL command:
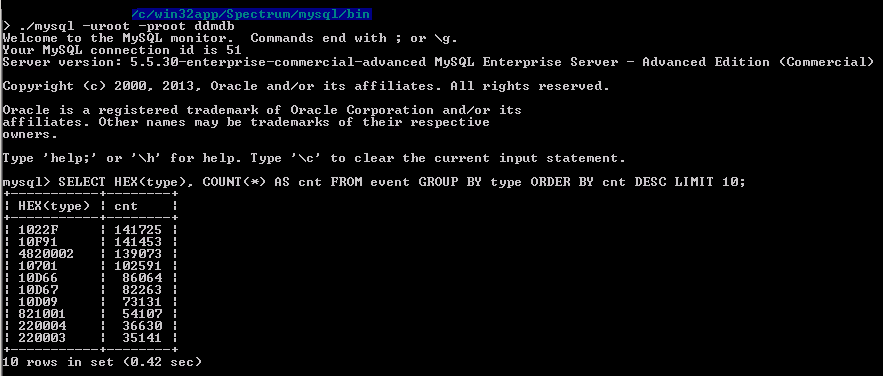
SELECT HEX(type), COUNT(*) AS cnt FROM event GROUP BY type ORDER BY cnt DESC LIMIT 10;
Another example: In the example below we are querying for highest event counts by type for a given time range:
SELECT hex(type), hex(node_id), count(*) as c from ddmdb.event where utime > UNIX_TIMESTAMP('2014-10-01 00:00:00') and utime < UNIX_TIMESTAMP('2014-10-02 00:00:00') group by type order by c desc;
Query for devices (model handle) generating the most events in question(DDMdb database):
In the example below we are querying for devices are generating the most 0x1030a events for a given time range:
SELECT hex(model_h), count(*) as c from ddmdb.event where utime > UNIX_TIMESTAMP('2014-10-01 00:00:00') and utime < UNIX_TIMESTAMP('2014-10-02 09:00:00') and type=0x1030a group by hex(model_h) order by c desc;
Here are the steps to create the Event Processing Filter:
1. Copy the event-processing-filter.xml and event-processing-filter-schema.xsd files to the 'custom' directory. For example, see the following syntax:
cp <$SPECROOT>/tomcat/webapps/spectrum/WEB-INF/repmgr/config/event-processing-filter-schema.xsd <$SPECROOT>/custom/repmgr/config/
cp <$SPECROOT>/tomcat/webapps/spectrum/WEB-INF/repmgr/config/events/event-processing-filter.xml <$SPECROOT>/custom/repmgr/config/
2. Edit the event-processing-filter.xml to reflect your selected filtering strategy.
For example, see the following syntax:
<ignore>
<event-type>0x10802</event-type>
<model>0x00d40010</model>
</ignore>
Note: You can only ignore events that are associated with specific models or event types.
3. Restart Tomcat.
The specified event processing filters are now in effect.
Note: Events code listed in the Appendix A of A Spectrum Report Manager Installation and Administration Guide Release 9.3 should not be added in the event-processing-filter.xml file.
Filtering Event Processing is discussed on page 78 of CA Spectrum Report Manager Installation and Administration Guide Release 9.4
Additional MySQL Queries:
Query for number of events in a given time frame (reporting database):
select count(*) from event where time >= '2014-09-28 00:00:00' and time < '2014-09-29 00:00:00';
This is useful the know the number of events processed per day by SRM.
Query to get the top ten models with the most events (DDMdb database):
SELECT HEX(e.model_h), m.model_name, COUNT(*) AS cnt FROM event e, model m WHERE e.model_h=m.model_h GROUP BY e.model_h ORDER BY cnt DESC LIMIT 10;
The MySQL query below will display the top 10 event IDs in the DDMdb databse:
SELECT HEX(type), COUNT(*) AS cnt FROM event GROUP BY type ORDER BY cnt DESC LIMIT 10;
The first column "HEX(type)" is the event code and the second colunm "cnt" is the number/amount of events. So the 0x1022f event happened 141,725 times in 45 days.
What if the disk is out of free space?
A) Increase the disk space
You will preserve the historical data. You can then manually delete unwanted events and then optimize the table to reclaim unused space. The disk space that is required to optimize the table is 1.5 times the table size for each table that is optimized.
Manual purge is discussed on page 94 of CA Spectrum Report Manager Installation and Administration Guide Release 9.3
https://support.ca.com/cadocs/0/CA%20Spectrum%209%203%200-ENU/Bookshelf_Files/PDF/Spectrum_Report_Manager_Install_Admin_…
How to Manually Purge Reporting Data from the Reporting Database
How to delete unwanted event in the reporting database
Here an example to delete a particular unwanted 0x10802 event from the reporting database:
1) Open a bash shell (bash -login)
2) Go to $SPECROOT/mysql/bin directory
3) Run:
./mysql --defaults-file=../my-spectrum.cnf -uroot -proot reporting
4) Run the following MySQL command to list the amount of 0x10802 event:
SELECT COUNT(*) FROM event WHERE type=0x10802;
5) Run the following MySQL command to delete the 0x10802 event:
DELETE FROM event WHERE type=0x10802;
6) Run the following MySQL command to optimize the event table:
OPTIMIZE TABLE event;
Note that if there a lot of rows in the table, both commands could take a long time. The OPTIMIZE command will allow the customer to reclaim the disk space vacated, and should speed up transactions.
Note also that, just to be safe, it would be prudent to backup the event table before deleting that much data.
How to delete old events in the reporting database
1) Open a bash shell (bash -login)
2) Go to $SPECROOT/mysql/bin directory
3) Run:
./mysql --defaults-file=../my-spectrum.cnf -uroot -proot reporting
4) Run the following MySQL command to list the first and the last event in the event table:
SELECT (MIN(time)) AS FIRST, (MAX(time)) AS LAST FROM event;
5) Run the following MySQL command to delete all rows in the event table that have a date earlier than 45 days ago, from the current date/time:
DELETE FROM event WHERE time < DATE_SUB(NOW(), INTERVAL 45 DAY);
6) Run the following MySQL command to optimize the event table:
OPTIMIZE TABLE event;
Note that if there a lot of rows in the table, both commands could take a long time. The OPTIMIZE command will allow the customer to reclaim the disk space vacated, and should speed up transactions.
Note also that, just to be safe, it would be prudent to backup the event table before deleting that much data.
Show the first and the last event in the reporting database:
SELECT (MIN(time)) AS FIRST, (MAX(time)) AS LAST FROM event;
Show the first and the last event in the DDMdb database:
SELECT FROM_UNIXTIME(MIN(utime)) AS FIRST, FROM_UNIXTIME(MAX(utime)) AS LAST FROM event;
B) Initialize the reporting database
The RpmgrInitializeLandscape utility will truncate all reporting tables, in order words, all data will be destroyed. And with -initHist 45 parameter, it will repopulate the reporting database with the last 45 days of data from the Archive Manager (45 days is the default setting to preserve the historical records on the Archive Manager - DDMdb database).
Here are the steps to initialize the reporting database:
1) Stop the Spectrum Tomcat service on the SRM (Spectrum Report Manager) machine
2) Open a bash shell (bash -login) prompt
3) Go to $SPECROOT/bin directory
4) Run:
./RpmgrInitializeLandscape.bat root root -initHist 45 -all
5) Start the Spectrum Tomcat service