Community App Catalog
Did you know about the plethora of awesome Custom Apps ready for you to install in Agile Central? These apps give you the power to view delivery metrics in new ways, easily communicate progress, and even automate data updates. This page is your guide to the most popular apps to install and try in your Agile Central at no cost.
These apps have been created by various folks, including CA’s Technical Services and developers who are passionate about helping Teams succeed. They are not included in Agile Central’s App Catalog due to the wide variety and specialization of apps. The App Catalog is focused on the most generally applicable apps, whereas these apps are more specific to unique situations.
If you are inspired to create your own apps, the Rally App Builder makes it easy to quickly start your own app from scratch or fork one of the apps below to enhance them.
CA makes each of these applications available to you subject to the terms for Beta Products set forth in the SaaS Listing for CA Agile Central and to any additional terms included with such applications. By accessing or using the applications, you agree that these terms for Beta Products govern your access to and use of the applications in conjunction with CA Agile Central.
How to Install Apps
If you’d like to install an app from the list below, there are two ways to do so:
- You can add an app as a one-off for a specific Custom Page by using the Custom HTML app. Instructions are at https://help.rallydev.com/use_apps. In short, you add the “Custom HTML” app to your page, then copy-paste the app’s HTML code into the app, and Save.
- You can add an app to your Subscription Level App Catalog to make them easily installed on any Custom Page. Learn more at https://help.rallydev.com/subscription-level-app-catalog
Reporting
Custom Chart
GitHub Project | Source Code to Install

About
This app is the chart equivalent of the Custom Board and Custom List apps. Pick a chart type (pie, bar or column), an object type, and a field to be aggregated and gain insight into your process via the generated chart. Use the advanced filtering control to further slice and dice your data. The data is also exportable for more fine grained inspection.
Use Cases
You need to see your data sliced and diced, and this app delivers! There are innumerable use cases for presenting your data just the way you want it, and here’s some ideas for inspiration:
- View your defects by resolution to determine how many require code changes versus user education.
- View your stories by estimate to see if story sizes are generally too big or too small which would indicate the team should recalibrate their sizing.
- View your features by investment category, aggregated by story leaf plan estimate to assess how you’re spending your time across your portfolio and adjust accordingly.
Super Customizable Cumulative Flow
GitHub Project | Source Code to Install

About
Cumulative Flow Diagrams (CFDs) are amazing ways to view your Team’s flow, and are available in Agile Central for iterations, releases, milestones, and other buckets. This app lets you further customize CFDs by choosing the type of item to track, the field you want to group by, and even the timeframe for the chart.
Note, this cannot be used in on-premises installations.
Use Cases
CFDs can answer many questions about your Team, such as:
- Forecast and track progress: The states of the scheduled work items indicate the progress of your development as it moves to completion. To determine if you are on target to complete the work within the scheduled iteration, track the accepted state.
- Manage scope: As your scheduled work item bars become level, it is easy to see when excess work is added to a timebox. If the level of the bars do not remain uniform and instead continue to increase, you need to re-address the scope of your timebox.
- Identify bottlenecks: Use the rolled-up states of your scheduled work items to determine if there are trends that indicate bottlenecks. For example, a large section of scheduled items in a completed state as compared to a small amount of accepted may indicate a testing roadblock.
Cycle Time Chart
GitHub Project | Source Code to Install
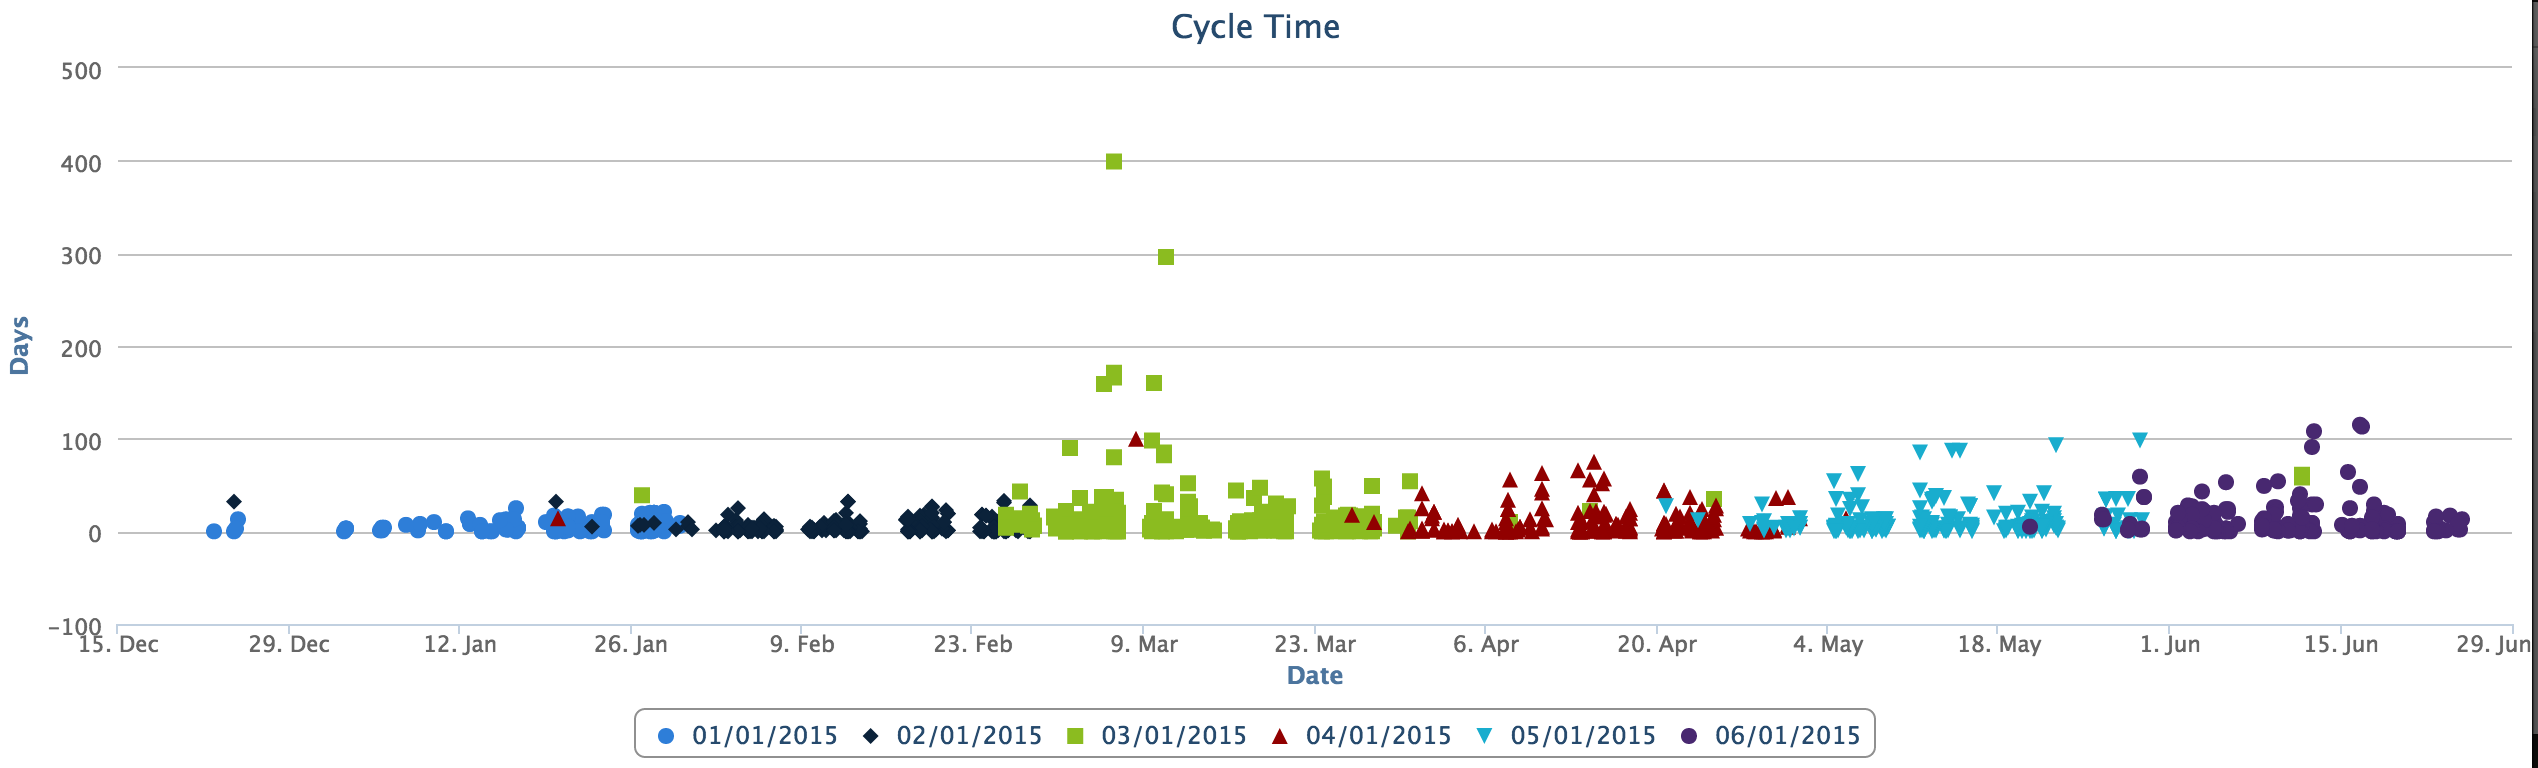
About
The Cycle Time is the time it takes for a work item to get from one state to another. Traditionally in Agile Central this is shown as a column chart - https://help.rallydev.com/cyclelead-time. This app shows your cycle time data as a scatter plot so you can view the distribution of cycle times and explore outliers.
Use Cases
Inconsistent cycle time will cause inconsistent delivery, so flow-based Kanban teams will love this chart as a way to identify deviations from their standard cycle times. The app includes percentile lines, and you can dig into the most inconsistent cycle times to identify root causes and improvement actions.
Query Counter
GitHub Project | Source Code to Install

About
This app may not look like much, but it’s a highly powerful tool to easily convey information to you, your Team, or stakeholders. Simply set a sentence of text, and a query, and this app will show you if there’s any items that match your query.
Use Cases
The uses for this app are endless:
- Create a data validation page to check for issues, like stories that are in progress with no estimate, or defects that are closed with no resolution set.
- Make a release dashboard that tracks items like open defects and how many features are still open.
- Report on your Team’s working agreements, like the size of your backlog if you’re trying to keep it reasonably groomed and the total number of items in process.
Many users like to put this app next to a Custom List that also shows the items that match the query so you can see the details.
Work Item Throughput
GitHub Project | Source Code to Install

About
When planning future iterations for your team, you might be curious about the past throughput to see how you're doing. The Work Item Throughput app gives you the opportunity to see user story and defect throughput for past timeboxes to help make decisions for future planning.
Use Case
By choosing between Count, Plan Estimate, Task Actual Total and Task Estimate Total for the way of measuring weekly throughput, you can use this as in retrospectives to determine what impacting your team's throughput and help determine how much work to plan for in the future.
Team Planning
Team Capacity Grid
GitHub Project | Source Code to Install

About
If you’re looking for an easy way to visually determine the remaining capacity for your team members, the Team Capacity app is for you! Once your team has added capacities for each member with the Track -> Team Status page, you can use this app to see your team’s capacity and utilization by project and iteration. There is also a Refresh button to allow easy edit of task assignments from other sources and redisplay status.
Use Cases
This app is an easy way to see team load based on capacity and task estimates. This is a vital part to any team’s dashboard for teams that value tracking individual capacity. This will also help you ensure you don't have any overloaded team members which could result in burnout and poor morale.
Rally Iteration Health
GitHub Project | Source Code to Install

About
This app is a great way to do a side-by-side comparison of the metrics for multiple iterations. Some of the metrics included in this chart are:
- Estimation Ratio - number of work items in the current iteration that have estimates associated with them
- Average Daily In-Progress - This is an indication of WIP (Work In Progress). It is the ratio of the average of the work items in the in-Progress state on a daily basis.
- Last Day Completion Ratio - This represents the ratio of work completed by iteration end. A low percentage might imply that there is work planned into an iteration that was left in a schedule state lower than completed
- Last Day Acceptance Ratio - This indicates whether teams met their commitment, assuming work items have not been removed from the iteration.
- Scope Churn - This is a measure of the change in the iteration's scope. Churn Direction (+/-) is an indicator of the general direction of scope change. Churn is defined as a standard deviation, which is always zero or positive, so this added indicator provides an indication of whether scope tended to be added or removed
Check out the GitHub page for this app to see all of the metrics you can measure!
Use Cases
By comparing various metrics for iterations, teams can work to identify areas for improvement and things that went well. There are many metrics you can look at for each iteration to help your team check out if your iterations are healthy or not.
Iteration Retro
GitHub Project | Source Code to Install

About
You can now easily facilitate Iteration Retrospectives, getting to action items to improve your Team’s performance. Retrospectives are a vital part of any agile Team and helps the team inspect and adapt their processes to be constantly improving.
Add this app to a page to take notes during a retro about aspects of the iteration that were great, or that could have been better. Finally, track the action items, updating them in the future as they’re completed. All information is saved on the Iteration object for later reference and can be accessed by everyone.
Use Cases
Distributed Teams will especially value seeing retrospective notes and actions wherever they are. The Team’s ScrumMaster can lead the retro via video conference while taking notes in Rally. You can even add other apps to the same page to make a one-stop hub to view an iteration’s performance and takeaways.
Quality Management
Release Test Case Trend
GitHub Project | Source Code to Install
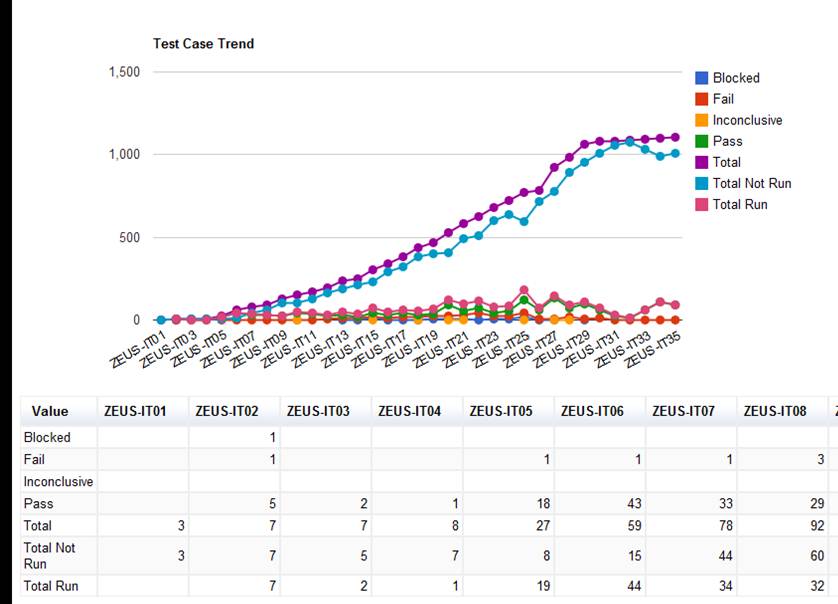
About
As you prepare for release, it’s crucial that quality is maintained and meets customer expectations. This app tracks your release by iteration to show how many test cases have been run, and what the results are.
Use Cases
Each iteration in your release will have more and more test cases run, and this app will show you the status of each. Use this app to ensure your Team isn’t blocked on test cases, and that the run tests are appropriately passing. It can be a great conversation piece with your Team around how quality is progressing in your release and identify issues.
Portfolio Management
PSI Tracking App
GitHub Project | Source Code to Install

About
The PSI Tracking App is a variant of the Iteration Status Page. This app shows the Features for a specified release and allows you to drilldown to the Stories, Defects, Tasks, etc. that roll up to the Feature.
It also give dashboard metrics for tracking the progress of the PSI / Release. The metrics are:
- Planned vs. Committed Velocity
- Release Days Left
- Percent of Stories with a Planned Estimate set
- Accepted Stories by Plan Estimate
- Accepted Stories by Count
- Late Stories (including a popover to see which Stories have been planned late)
- Pie Chart for Features to Stories progress
Use Cases
This app is your command central for a Release. See exactly what’s in a release by drilling down to the smallest unit of work, or keep your tracking at the high-level features. Use this app for early warning signs from the quick metrics. It can also be a great simplified experience to get stakeholders information about a release.
WSJF
GitHub Project | Source Code to Install

About
When trying to determine which work to start on first, many teams use WSJF (weighted shortest job first), which is a lean method for determining backlog prioritization using the cost of delay and remaining job size. The WSJF board allows your team to calculate WSJF scores based on Risk, Value, TimeCriticality and JobSize so you can determine what should be worked on first.
Use Cases
Your team is trying to deliver value quickly and want to do a comparison of features/initiatives/etc based on the cost of delay and job duration. More information can be found here.
Portfolio Item Copy
GitHub Project | Source Code to Install
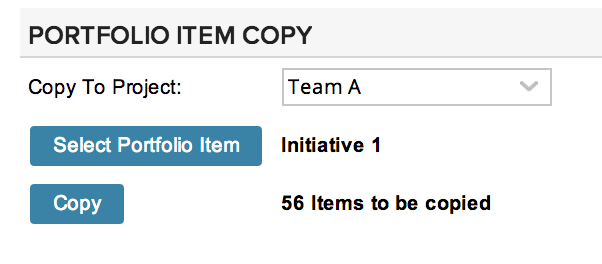
About
Have you ever wanted to copy a portfolio item and all of its children? Then this app is for you! Simply select the project and portfolio item to copy, and it will make a copy of that portfolio item and its descendants, including other portfolio items, user stories (including user story hierarchies) and tasks.
By default, it copies the following fields:
- Name
- Description
- Owner
- Parent
- Tags
If there are required fields, the app will attempt to copy those fields as well. If the Release field is required for stories, the app will present the user with a drop-down box for default release to put in as a placeholder for any parent stories that are being copied.
Use Cases
This is a great way to use an existing portfolio item as a template, or if you’re starting work on a similar portfolio item and don’t want to start creating it from scratch.
PI Scope Change Chart
GitHub Project | Source Code to Install
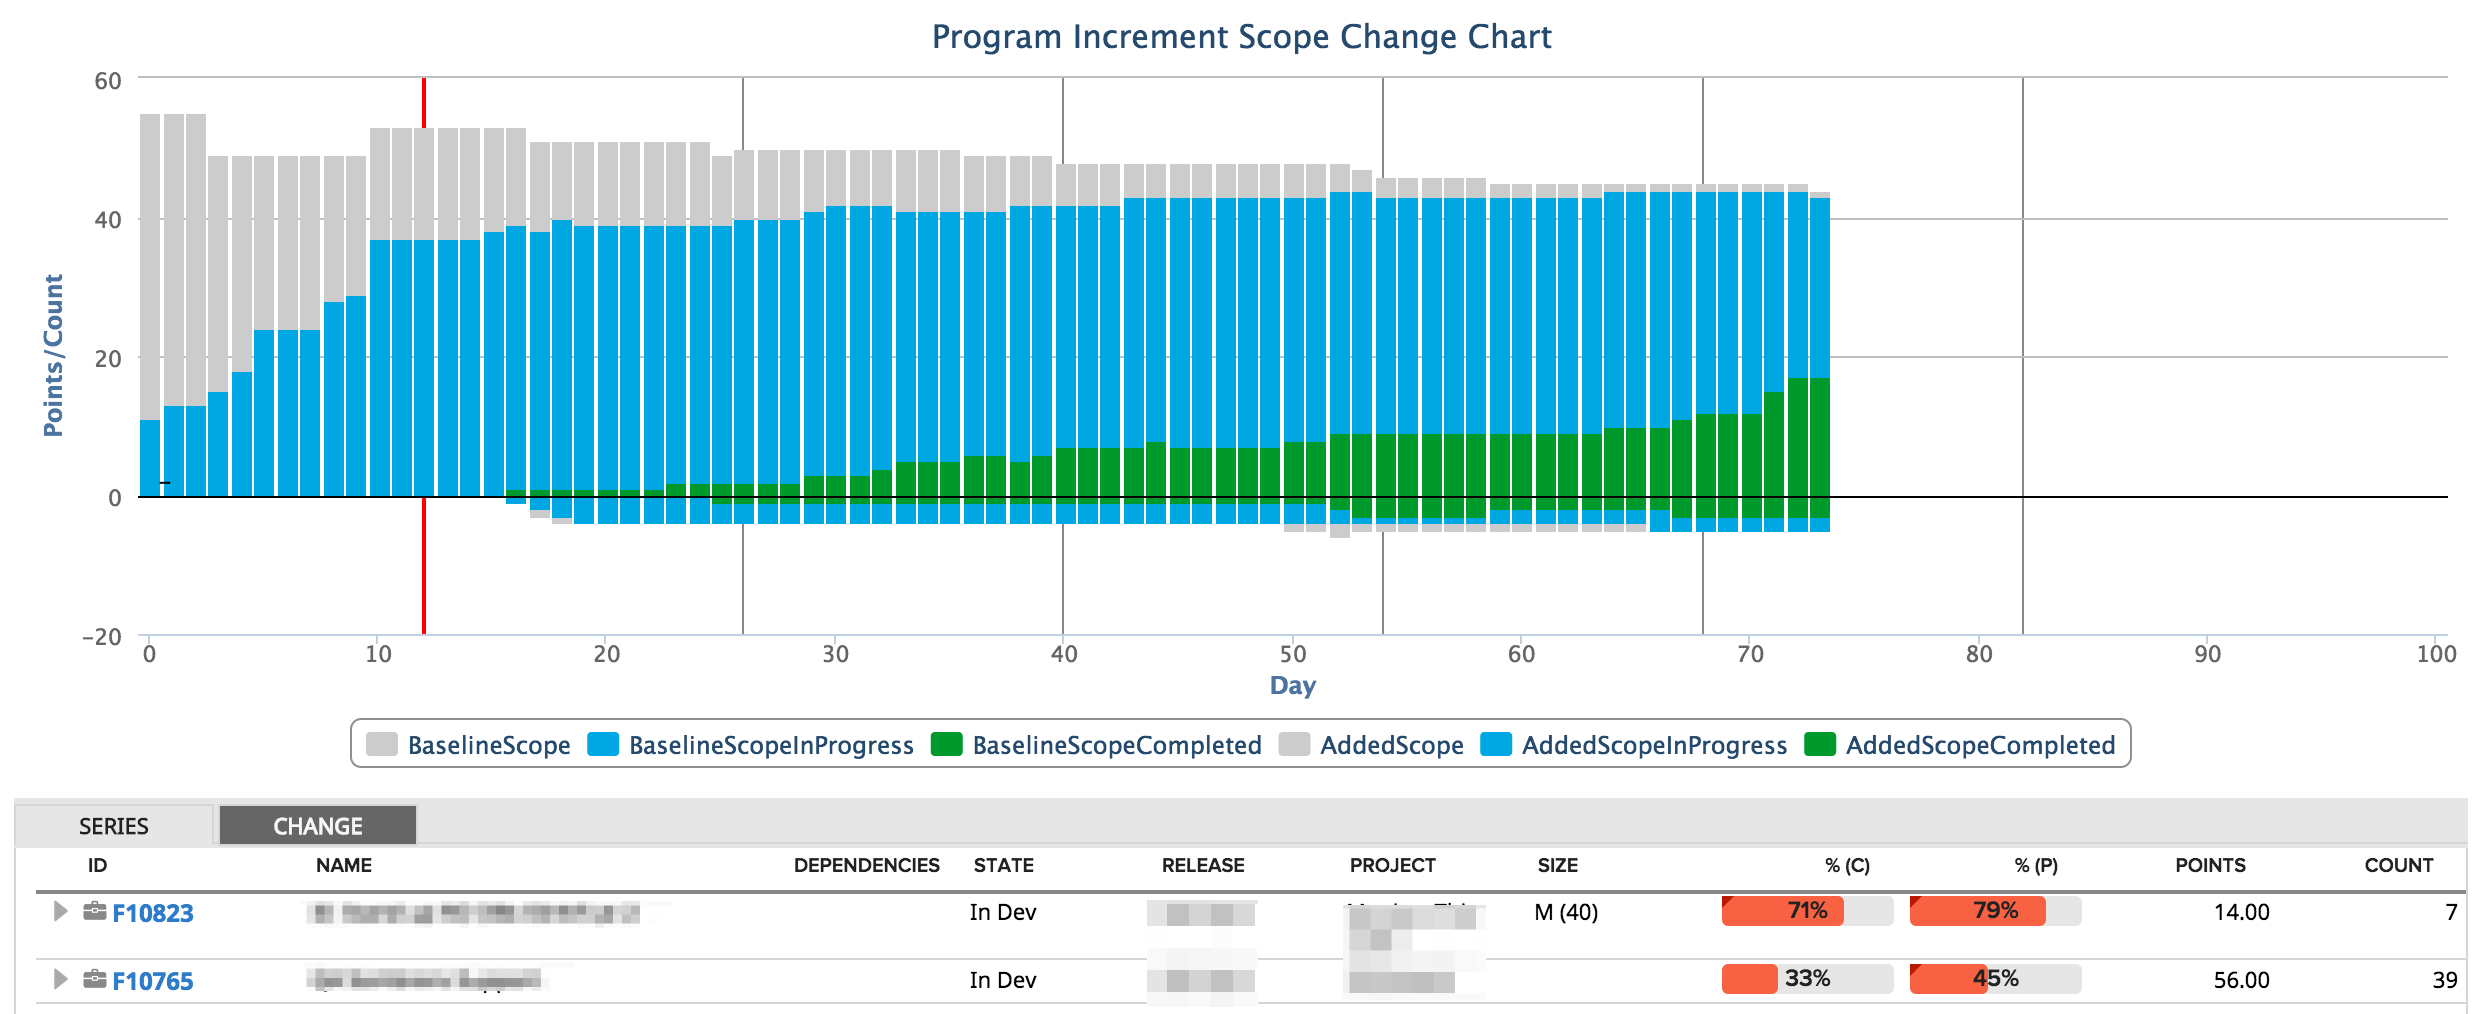
About
This chart visualizes the change in feature commitment during a release / program increment.
Features not in the original baseline will be shown "below the line" while features removed will be removed from the top.
Clicking on any series will open a tabbed panel below. The 'Series' tab shows the features in the selected series. The 'Change' tab shows all features added or removed since the baseline.
Use Cases
This will be useful to determine if changes in scope are impacting delivery of original scope. It uses the concept of a baseline which can either be based on the first day of the release or at the end of the first sprint.
Data Utilities
Bulk User Utility
GitHub Project | Source Code to Install

About
It’s time to save time with this bulk user utility. Assign permissions, remove permissions, and add team membership easily. With advanced filters and a custom user list feature, you can make your changes and get on with your day.
Use Cases
If you’re the administrator of a large subscription, you need this app. You can now set up a new Team all at once, rather than updating each Team member individually. And you can process department-wide changes too with just a few clicks. Get your list of users, add them to the usernames filter, and pick your change. The refill your coffee with the extra time.
Custom Grid with Deep Export
GitHub Project | Source Code to Install

About
Have you ever wanted to export user stories with their children? With the Custom Grid with Deep Export, you can filter for the stories you are looking to export, then export them with their children.
Use Cases
You can use this app if you have a past or current set of stories and tasks that are similar to some new work that you are planning, so you can copy them to create a basis for your new work.
More Apps
If you’d like to find even more great apps, you can browse GitHub at https://github.com/RallyCommunity or use your search engine of choice to search for “Rally” and the functionality you’d like (most apps have not been renamed to “Agile Central”). Once you find an app, look in the ‘/deploy’ folder for App-uncompressed.html or App.txt for the HTML to put in the Custom HTML app. Happy hunting!