Introduction
The development of this type of alarm was suggested by the need to be able to detect the sudden absence in the Investigator of an agent under monitoring, and was subsequently extended to the detection of the absence of specific application components within an active agent.
In the first case, the alarm is associated to the unavailability status of the Java process under monitoring, and is applicable both to the unavailability of an application server and to the unavailability of generic Java processes such as Wily PowerPack for Oracle, the PowerPack for Webserver, the EPAgent. The metric on which this implementation is based is the GC Heap: Bytes In Use.
In the second case, the alarm is associated with the unavailability of specific components, such as an EJB-Timer. In this case the metric on which the implementation is based is the Responses Per Interval.
In this document we will refer only to the first case.
The availability alert basics
The alarm is implemented starting from a Metric Grouping that collects 2 distinct metrics, the first is the metric that represents the activity of the component itself, which must assume a non-zero value when the component is active, the second is a metric which assumes the value zero for all the intervals, and is generated at the MOM level. When the first metric disappears from the Investigator, in the Metric Grouping, and then in the alarm, only the zero constant remains and the alarm changes state signaling the anomaly. This is also reported when the first metric, while not disappearing, takes the value zero for a certain number of intervals.
The constant zero metric
In the following paragraphs 2 solutions will be highlighted to have available an always active metric that takes only the zero value for each interval.
Metric “zero” obtained from those available in the Investigator
In an APM infrastructure with Collectors, the EM Historical Metric Clamped metric of the MOM, which indicates whether the number of live metrics of the EM exceeds or not the configuration value (introscope.enterprisemanager.metrics.historical.limit), is always equal at zero, and can therefore be used for the aforementioned configuration.

The regular expressions to "point" this metric are as follows:
Agent Expession:
(.*)\|Custom Metric Process \(Virtual\)\|Custom Metric Agent \(Virtual\)
Metric Expression:
Enterprise Manager\|Connections:EM Historical Metric Clamped
Metric “zero” obtained through user implementation
- A constant and zero metric can be obtained by following the following steps:o Generate a MG (Always-zero-mg, in the example) that does not point to any active metric.o From the Management Module Editor select New Metring Grouping from the Elements tab

- Assign a name to the MG (Zero-K-mg, in the example) and a destination MM (AAA-TEST-MM, in the example)

- Leave the Metric Expression field empty and save (OK)

- Starting from the MG configured, define a calculator, right click on the MG and then left click on the field New Calculator from ...
- populate the mandatory Destination field with the same name as the calculator (in the example Always-zero-mg).

A calculator configured in this way will always assume the value zero, as well as the virtual metric connected to it, which is automatically generated by the product when the calculator is activated. This metric is exposed in the Investigator as shown in the following figure:
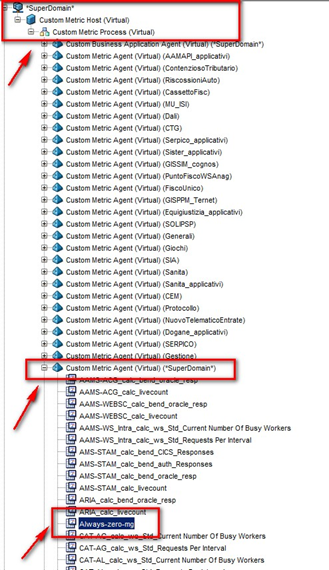

This metric can then be used in the implementation of the custom availability alarm, pointing it with the following regular expressions, taking into account the names used in the example:
Agent expression
(.*)\|Custom Metric Process \(Virtual\)\|Custom Metric Agent \(Virtual\)
Metric Expression
Always\-zero\-mg
The representative metric of a Java process activity
The metric used is the GC Heap: Bytes in Use, which in case of active process is always different from zero. In order to make the alarm more "robust", the metric was processed by means of a js calculator js, which outputs the percentage value of the GC Heap: Bytes In Use, which is named at the GC Heap: Bytes Total metric. This metric is exposed in the same directory as the other 2, GC Heap, and is called Memory_PercentInUse.The advantage of using the normalized metric processed by the calculator js, is that in the code the case of receipt of NULL values of the Bytes In Use metric by the Collector is managed. This possibility could be determined, for example, by a temporary communication anomaly between Agent and Collector, not dependent on the real state of the Agent, but would trigger the alarm, regardless of the configuration of this in terms of PeriodsOverThresold / PeriodsObserved. The NULL in these cases is instead converted into a zero and treated as such by the MOM. This solution proves to be essential in cases where an alarm notification action is connected as it eliminates many false positives, barely visible through a dashboard, as the signal turns green quickly, but very evident if we think of an email notification or messages send to Service Control Room.

Configure an AS Availability alert
The steps necessary to configure the availability alarm of an AS are shown in the following paragraphs
Metric Grouping settings
- In the Investigator locate the Agent to be monitored for availability alert, open the GC Heap folder and right click on the Memory_PercentInuse metric

Using left click select New Metric Grouping from ....

- In the small panel that appears, set the name (Availability-AS-name) and confirm


- In the Metric Grouping Agent Expression add the postfix (|% (. *)) And save

- The addition of the postfix is necessary to manage the appearance of the% character in the name of the Agent.
- Press the Add button in the Expression field

- There are two new editable fields

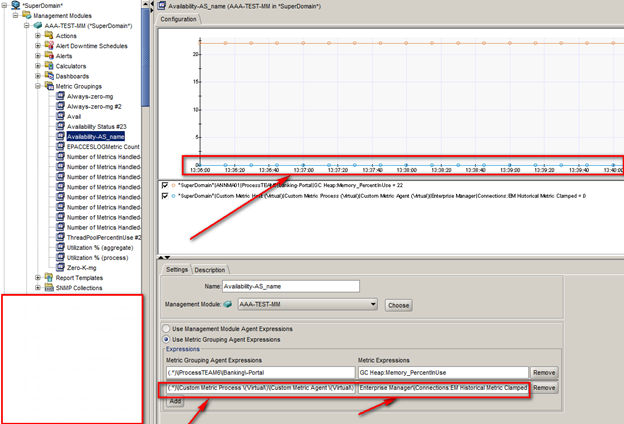
- In the editable fields that appear, enter
Metric Grouping Agent Expression :
(.*)\|Custom Metric Process \(Virtual\)\|Custom Metric Agent \(Virtual\)
Metric Epression :
Enterprise Manager\|Connections:EM Historical Metric Clamped ( if you intend to use the zero metric available from the product)
or
Always\-zero\-mg (if you intend to use the zero metric defined by the user, as shown previously)
Save
Check the zero value metric in the graph
Alert Configuration
- Right-click on the MG Availability-AS_name

- Select New Simple Alert from…

- In the small panel that appears, enter the name (Availability-AS_name-sa) and confirm (OK)

- The alarm configuration panel appears

Active: flagged
Combination : All
Comparison Operator : Equal To
Trigger Alert Notification : Whenever Severity Changes
Danger Thresold : 0
Danger Periods Over Thresold : 10
Danger Observed periods : 20
Caution Thresold : 0
Caution Periods Over Thresold : 0
Caution Observed periods : 20

-Press Save
-The alert has been configured and activated