Hi Kiran,
nearly a year has gone since I already presented a mostly working Topology-View in HTML5 (DevXChange, London 2015) and I had posted a lot of screenshot here in the community.
We are all waiting for it.Simply copy the functionality of the current Java-Topology-View. It works great in combination with the Spotlightviews as filters.
Do not forget to make the Tooltips customizeable via XML or other solutions.
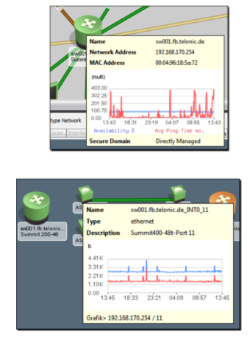
I have many customers, where we modified the tooltips to present graphs (PNG-Charts) inside the tooltips.
Many open-source-tools like PHP-weathermap, Check_MK or Nagvis provide a simple way to template/format and include external/internal content into the tooltips to enrich the Mouse-Over-effects. Perhaps these could be a source for new ideas.
For the current Java based Oneclick-Topology, I used the existing XML-Files to modify the tooltips.
Nagvis
http://docs.nagvis.org/1.3/en_US/hover_templates.html
Nagvis-Demo (nagiosadmin/nagiosadmin)
http://demo.fullyautomatednagios.org/nagvis/frontend/nagvis-js/index.php
Sometimes, customers asked to get a Topologyview which reflect the utilization of the links in "percent Usage" or as "total Usage" which mostly could be done by PHP-Weathermap. I would suggest to implement something like that as 2 new Spotlight-Views. .. but that´s not a "High-Prio"-Requirement.
Weathermap-Demo
http://network-weathermap.com/manual/0.97b/example/example.html
http://network-weathermap.com/manual/0.97b/pages/main.html#example
.... last statement:
simply copy the functionality of the existing one.