DX Application Performance Management

Expand all | Collapse all

Analysis report of Introscope (comparing values) Part 2

  • 1.  Analysis report of Introscope (comparing values) Part 2

    Posted Jul 15, 2016 03:55 PM

    Hello! Could help me with this analysis?
    Analysis period:
    15.06.2016 to 07.15.2016 In two (2) examples below
    Used Metric: Responses Per Interval


    1. What time frame are you using on the historical metric image? Default Period: Auto


    2. What resolution are you using on the historical metric image? I do not know where it is defined


    3. What time frame are you using on the report? 30 days


    4. What are the duration and unit are you using on the report? I do not know where it is defined


    5. What regex are you using for the metric group? I do not know Report


    6. On the report template, do you have "aggregate data by group" set to on or off? Switched on


    7. On the report template, do you have "aggregate using" set to sum or average? average!


                                            ---------------------------------------

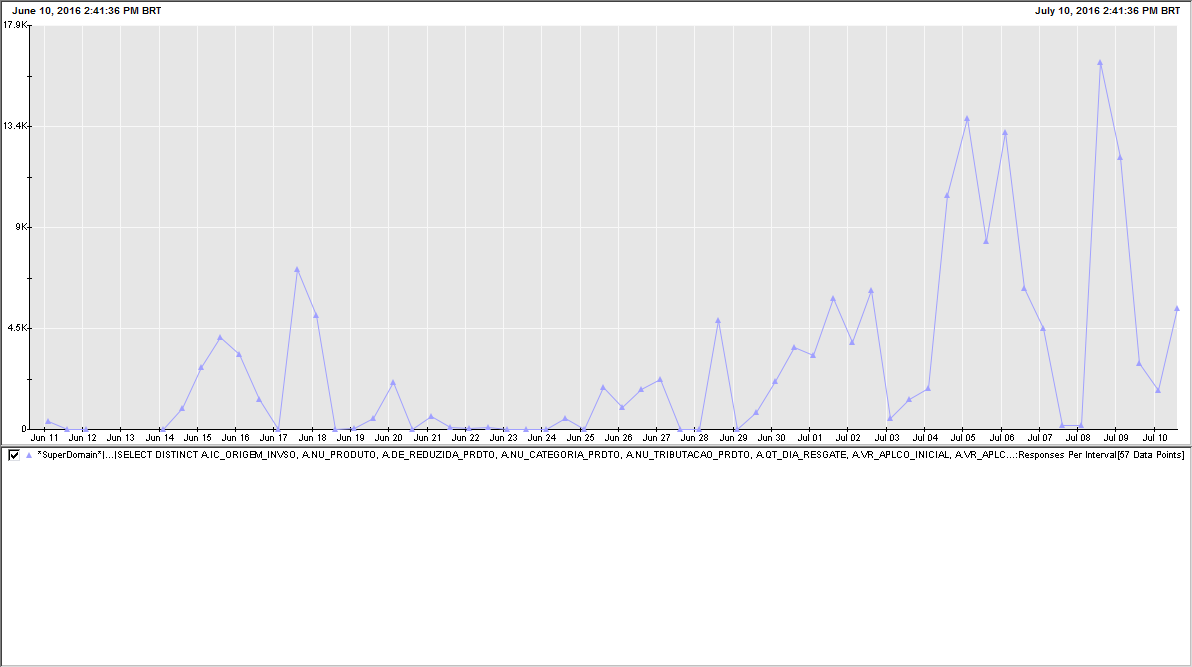
    In the example below we have a chart generated by the following query (below) with the following metric Responses Per Interval


    select_query.png


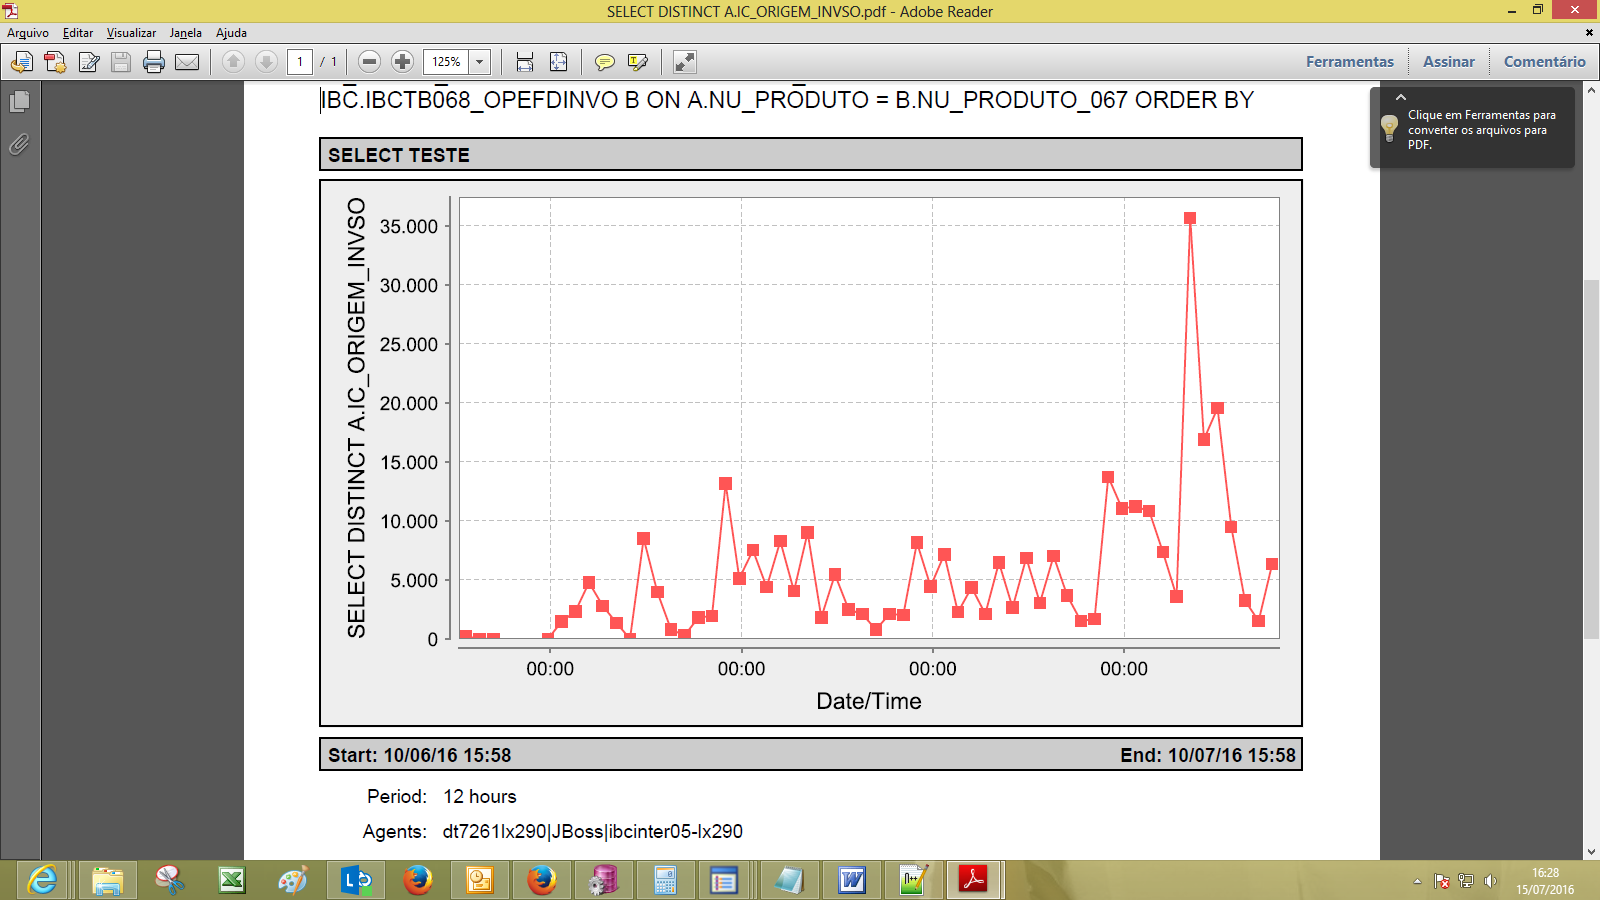
    In the example below we have a report generated in Introscope the same query from the above example, we can see that the values have a big difference. You can tell me why that?
    My biggest doubt is that why this difference in values!


    select_query2.png


    .


  • 2.  Re: Analysis report of Introscope (comparing values) Part 2

    Broadcom Employee
    Posted Jul 15, 2016 04:00 PM

    Hi Ricardo:

    I am converting this to a question to get you more responses and keep discussions clear

    Thanks

    Hal German


  • 3.  Re: Analysis report of Introscope (comparing values) Part 2
    Best Answer

    Broadcom Employee
    Posted Jul 15, 2016 04:08 PM

    There is a huge difference in the metrics you're displaying in the screen captures.


    1. Why did you choose to show a 30 day and a 12 hour view for comparison?
    2. You need to go back into the template to view all of the settings and understand their meaning. Please take the time and look at the wiki for details.


    Please keep in mind that SmartStor aggregation will cause the data points to appear differently too, depending on how you defined the tiers for aggregation.


  • 4.  Re: Analysis report of Introscope (comparing values) Part 2

    Posted Jul 15, 2016 05:05 PM

    You have a Default Display the report Properties in manual Introscope


    Thank you


  • 5.  Re: Analysis report of Introscope (comparing values) Part 2

    Broadcom Employee
    Posted Jul 15, 2016 05:10 PM

    Can you repost an image from Introscope with the same timeframe as your report?


  • 6.  Re: Analysis report of Introscope (comparing values) Part 2

    Posted Jul 15, 2016 05:24 PM

    Follow


    003.png


  • 7.  Re: Analysis report of Introscope (comparing values) Part 2

    Broadcom Employee
    Posted Jul 15, 2016 05:40 PM

    Please repost the Introscope graph, not the report, with the same timeframe and resolution.


    Also, please start your question with the version of APM you're using.


  • 8.  Re: Analysis report of Introscope (comparing values) Part 2

    Posted Jul 15, 2016 08:20 PM

    Hi! Follow image

    Version Introscope 10.1


    introscope_004.png


    Thank You!

    Att

    Ricardo


  • 9.  Re: Analysis report of Introscope (comparing values) Part 2

    Broadcom Employee
    Posted Jul 16, 2016 09:50 AM

    The last data point for July 8, what is the maximum value for that?

    Can you repost the Introscope graph again,but this time enable showing the min/max values?


  • 10.  Re: Analysis report of Introscope (comparing values) Part 2

    Posted Jul 18, 2016 02:09 PM

    Follow, Haruhiko!


    select_query18072016.png


  • 11.  Re: Analysis report of Introscope (comparing values) Part 2

    Broadcom Employee
    Posted Jul 18, 2016 04:51 PM

    Based upon your images, I'd suggest you follow Hal's suggestion and open a support ticket. It's either the report setup or something else going on where you're getting these high values.


  • 12.  Re: Analysis report of Introscope (comparing values) Part 2

    Posted Jul 18, 2016 09:27 PM

    OK! Thank you! anyway ... I'll check it ..


  • 13.  Re: Analysis report of Introscope (comparing values) Part 2

    Broadcom Employee
    Posted Jul 15, 2016 05:22 PM

    Hi Ricardo:

      Recently, you asked a series of questions about APM Reporting interpretation.

        To move forward, please answer Hiko's question and consider following on his suggestion to review the report menu options and APM documentation to better understand this functionality.


       Thanks

    Hal German


  • 14.  Re: Analysis report of Introscope (comparing values) Part 2

    Broadcom Employee
    Posted Jul 18, 2016 09:40 AM

    Hi Ricardo:

        I am marking this as answered. There have been seven posts back and forth between you and Hiko and the problem is still being determined. I strongly recommend opening a case to seek resolution as well as following up on Hiko's suggestion of reviewing APM training and documentation on reporting


    Thanks

    Hal German