When an issue occurs, sometimes you are able to fix it on your own. However, you still want to know the root cause analysis (RCA) why it happened. In order for Support to provide a root cause analysis, the issue needs to be captured in a trace. Below are steps how to enable and disable the trace from the UserInterface.
Depending on the issue, tracing needs to be turned on for 5 minutes to capture the issue.
If you are reproducing a specific, on-demand issue, leave the trace on until you complete the reproduction then turn it off.
Here are the standard trace settings:
Automation Engine
Enable the trace on
every single CP.
Go to your System Overview > Automation Engine > right-click one of the CP > Properties > set
TCP/IP=9 https://us.v-cdn.net/5019921/uploads/editor/s5/h36darxzd7lp.jpg"
 width="1111">
Enable the trace on
just one WP.
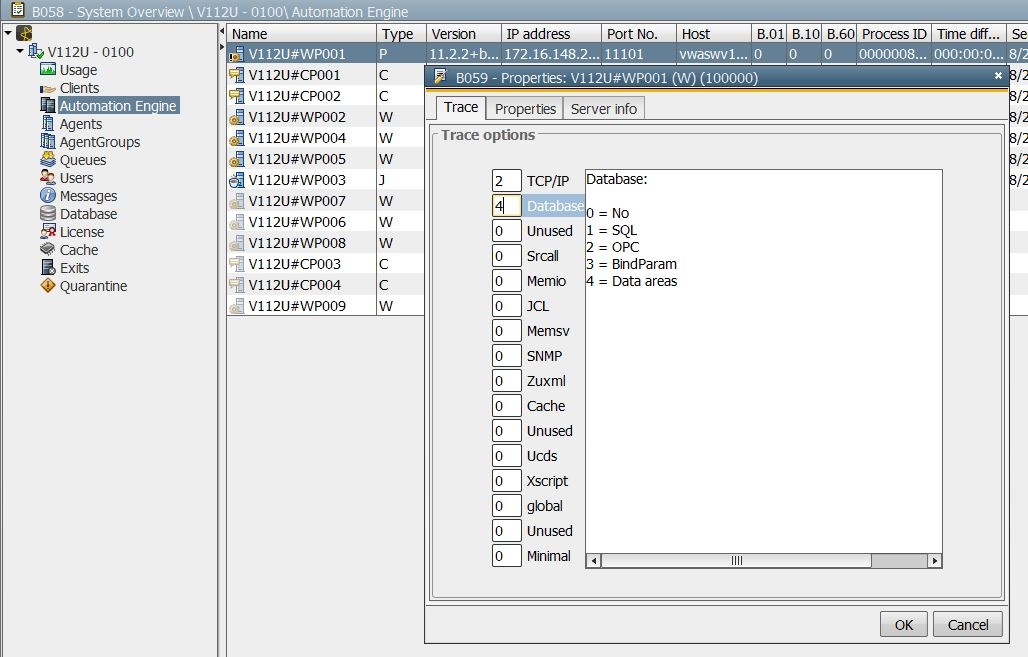
Go to your System Overview > Automation Engine > right-click one of the WP > Properties > set
TCP/IP=2 and DB=4 https://us.v-cdn.net/5019921/uploads/editor/ef/q5ehdh51tx8m.jpg"
 width="1028">
Agents
Go to your System Overview > Agents > right-click on the agent > Properties
 https://us.v-cdn.net/5019921/uploads/editor/mq/db0djz4ep0r8.jpg"
 width="1066">
These are standard tracing:
1. For
OS agents (i.e. Windows, Unix, etc)
Set
TCP/IP=92. For
RA agents (i.e. RA FTP)
Set
TCP/IP=9, RA=9For tracing on specific issues:
3.
File transfer issue
TCP/IP=94. If there is a
content issue with the file transfer (i.e. corrupted)
TCP/IP=9, Filetransfer=9Note: Sometimes recommended tracing differ from standard tracing because it needs to be customized specifically for the type of issue you are facing (i.e. SAP, etc). In this case, please contact Support.
How to Disable the Trace
To disable the tracing, simply return the value back to 0 and save.
What Files Are Needed
Now that you have captured the issue in a trace, it is time to provide Support the appropriate files.
For Automation Engine:A. CP logs and CP trace files
B. WP logs and WP trace files
For Agents:C. Agent logs and Agent trace files
D. The problematic job's RUNID and/or Date and Timestamp of when the issue occurred
E. ALL of the problematic job's Job Reports and Job Details
Note: Please do not turn on tracing at all times. Only turn it on when you want to capture an issue. Once issue is captured in a trace, please turn off the trace.