DEFINITION :
The Real-Time History allows instant control of the server's activity. By default the Real Time collection period is 15 seconds and sends them to the Console (60 values are displayed in the R-T graphs).
PERIODICITY :
- Stores in RAM the last 60 Real-Time values (R-T).
- The collection of the R-T period can be changed from 5 to 60 seconds.
CONFIGURATION:
How to set the period:
You can define the period with the Console or in the Collector configuration file.
1 - Right-click on the Monitored Object.
2 - Select menu "Modify Parameters" > "Define Collector parameters..."
3 - In the section "
Real-time Analysis Period" you can define the collection period (in seconds):
 https://us.v-cdn.net/5019921/uploads/editor/wn/fe4hytpey805.png" width="685">
4 - Click on  to validate the new parameter.
5 - Restart the Collector.
- In the Collector configuration file:
1 - Edit the Collector configuration file
2 - Modify the "piod" parameter in the [PIOD] section:
[PIOD] piod#Format : Integer in the interval [5,120] #Optional/Mandatory : Mandatory #Collecting period (in seconds) #Set to "15" in the default the configuration file #To be set in the interval [5-120] #Console labels (EN) : Section [Real-time analysis period]"Period (seconds)"
3 - Save the modifications.
4 - Restart the Collector.
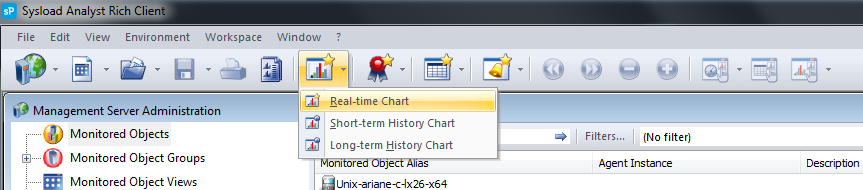
HOW TO CREATE A REAL-TIME GRAPH:
1 - Click on

or select in the toolbar File > New > Chart > New Real-time chart
2 - Select the Monitored Objects and the metrics you want to monitor:
 https://us.v-cdn.net/5019921/uploads/editor/kr/lx1ola2c61rn.png"
 width="746">
The graph displays the current Real-Time values and the last 60 values (stores in the Collector's memory):
You can also display the Real Time Top (Open Real Time Top):
 https://us.v-cdn.net/5019921/uploads/editor/r2/xyo4eabundic.png"
 width="560">
For complete settings in this section, refer to the
console documentation.