Hi.
We have several things in this area. From top of head:
- process monitoring with Nagios (NOT for hung processes, just checking the way "ps" would)
- "heartbeat" dummy JOBF or JOBS that get executed and the result monitored by Nagios, thus verifying the actual funtion of engine and each individual agent (as FrankMuffke aka Wolfgang Brückler already mentioned)
- I have a bunch of cron jobs that read from the DB via SQL and monitor MQ (message queues) levels *), the count of active objects by department (to warn me of spikes in usage by individual organisational units), licenses count **) and monitor for changes in the host table (to warn me when someone adds Agents **). If you need some of these SQL queries, shoot me a PM.
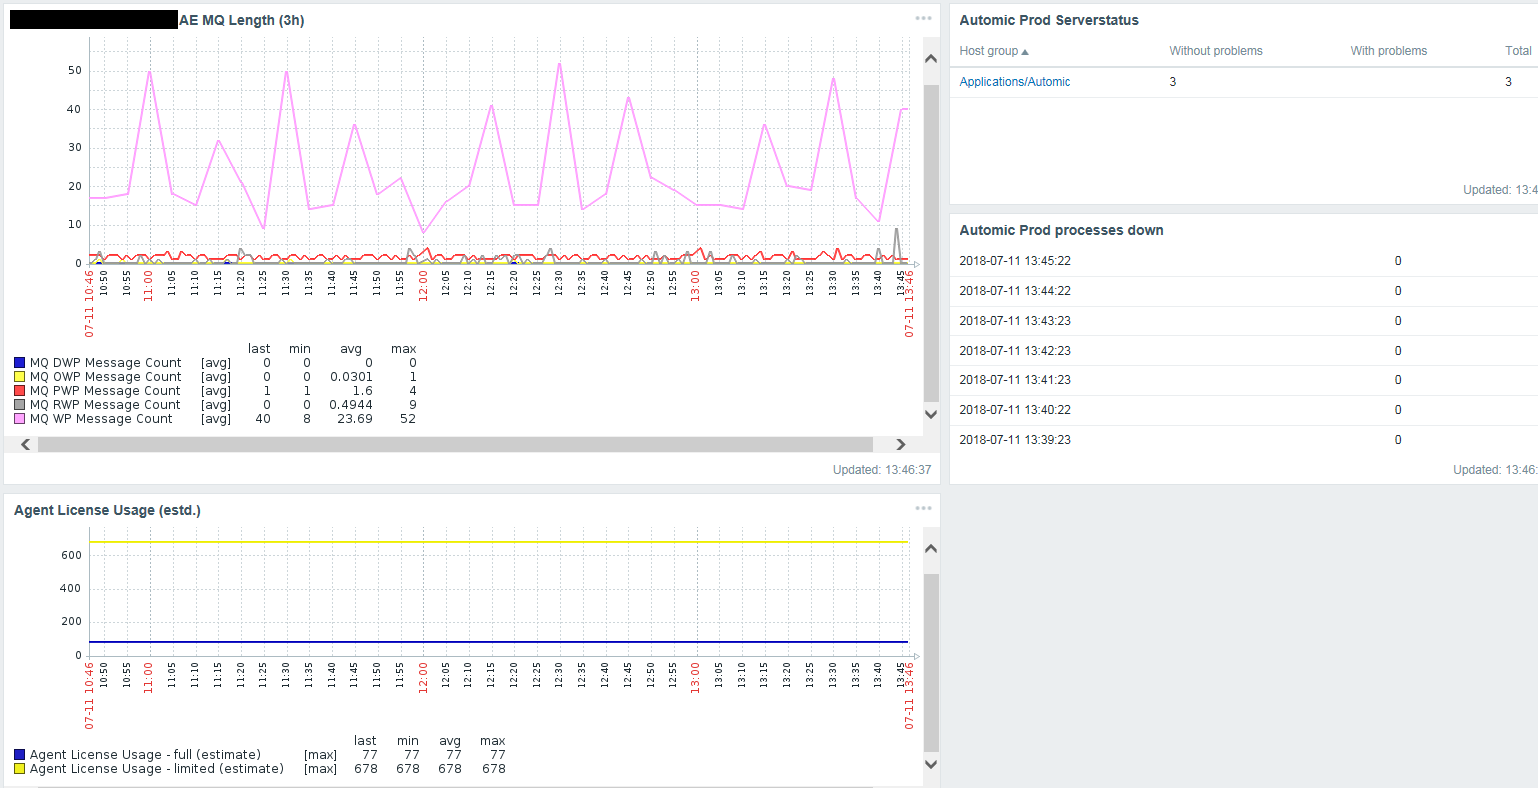
Some of these jobs feed into Zabbix, which is the companies choice for plotting diagrams.
Booknotes:
*) queue levels are unfortunately pretty much a binary indicator for system health, as far as Automic is concerned. Queue levels are either "oh, don't worry, an MQMEM of a few thousand items is still totally okay" or "oh, the system stopped". I don't know of useful "official" tresholds thus far beyond which a queue can be considered too full, but I made my own tresholds over time by looking at the "usual" queue levels, and when those do get exceeded, I get an alert and can take a more in-depth look at the system.
**) licenses have to be monitored because other people in the organisation can install agents without telling me, and agents immediately consume licenses without server admin intervention, which is bad design. So I run the Automic license analyzer query once per day, and have a script that tries to emulate the same data processing that Automic (by my guesses) does with the data, thus giving me a reasonable guesstimate on the number of used licenses that Automic would calculate at the annual audit, to make sure I never exceed that number on any given day. - Inside Automic, I have a "Server Monitor" script that monitors queues and load levels, using the Automic functions, warns via email for any violations, and also feeds into text files, which then get farmed by Zabbix for drawing diagrams of queue levels. It also keeps a running total of dead Automic processes, and can notify people if e.g. more processes keep dying. Here's my code (company internals removed) - it probably sucks, I suck at AutomicScript
!Server Monitor with Zabbix Feed: This version is a clone off of the Server
!Monitor script which runs as a JOBS, and writes counters to files on the
!central UC4 utility server. The text files with counters can then be processed
!in Zabbix or any other diagram drawing app.
!questions? -> cschmitz

!configure the name of the variable object used for keeping state here.
!object must exist
:SET &STATEVAR_NAME# = "VARA.DC1.SERVER_MONITOR_STATE"
:SET &CONFIGVAR_NAME# = "VARA.DC1.SERVER_MONITOR_CONFIG"

:SET &MAIL_RCPT# = GET_VAR(&CONFIGVAR_NAME#, "email_recipient")

!fallback if empty
:IF &MAIL_RCPT# = ""
:  SET &MAIL_RCPT# = "go_ahead_send_me_spam@example.com"
:ENDIF

:SET &VER_INFO# = SYS_INFO(SERVER, VERSION,ALL)
:SET &SERVER_OPTS# = GET_UC_SETTING(SERVER_OPTIONS)

:SET &LOAD_01# = SYS_BUSY_01()
:SET &LOAD_10# = SYS_BUSY_10()
:SET &LOAD_60# = SYS_BUSY_60()

!wow, this is silly
:SET &LOAD_01_FMT# = FORMAT(&LOAD_01#)
:SET &LOAD_10_FMT# = FORMAT(&LOAD_10#)
:SET &LOAD_60_FMT# = FORMAT(&LOAD_60#)

!PWP is the only one that has load averages for it's MQ
:SET &MQ_PWP_BUSY_01# = SYS_INFO(MQPWP, BUSY, 1)
:SET &MQ_PWP_BUSY_01_FMT# = FORMAT(&MQ_PWP_BUSY_01#)

:SET &MQ_PWP_BUSY_10# = SYS_INFO(MQPWP, BUSY, 10)
:SET &MQ_PWP_BUSY_10_FMT# = FORMAT(&MQ_PWP_BUSY_10#)

:SET &MQ_PWP_BUSY_60# = SYS_INFO(MQPWP, BUSY, 60)
:SET &MQ_PWP_BUSY_60_FMT# = FORMAT(&MQ_PWP_BUSY_60#)


!Message queues outstanding messages count
:SET &MQ_PWP_COUNT# = SYS_INFO(MQPWP, COUNT)
:SET &MQ_WP_COUNT# = SYS_INFO(MQWP, COUNT)
:SET &MQ_DWP_COUNT# = SYS_INFO(MQDWP, COUNT)
:SET &MQ_OWP_COUNT# = SYS_INFO(MQOWP, COUNT)
:SET &MQ_RWP_COUNT# = SYS_INFO(MQRWP, COUNT)

!Message queue average processing times
!
!beware: if you get something like "20877", that's actually a
!return code printed in place of the result, letting you know
!that e.g. the period parameter is not accepted!
!
:SET &MQ_PWP_AVGTIME# = SYS_INFO(MQPWP, LENGTH, 1)
:SET &MQ_WP_AVGTIME# = SYS_INFO(MQWP, LENGTH, 1)
:SET &MQ_DWP_AVGTIME# = SYS_INFO(MQDWP, LENGTH, 1)
:SET &MQ_OWP_AVGTIME# = SYS_INFO(MQOWP, LENGTH, 1)
:SET &MQ_RWP_AVGTIME# = SYS_INFO(MQRWP, LENGTH, 1)

!send email if various values are out of boundaries

:IF &MQ_PWP_COUNT# >= 30
:  SET &RETVAL# = SEND_MAIL(&MAIL_RCPT#,,"PWP MQ Count exceeded limit on &$SYSTEM#","Warning: Message queue count of PWP on &$SYSTEM# is currently &MQ_PWP_COUNT#")
:  IF &RETVAL# <> 0
:    PRINT "ERROR: Sending Email failed with code &RETVAL#!"
:  ENDIF
:ENDIF

!possibly ten minutes would be the most interesting, with one being to twitchy
!and the hour too laggy - IF the averages were to work as advertised, which
!they don't seem to do

:IF &LOAD_10_FMT# >= 90
:  SET &RETVAL# = SEND_MAIL(&MAIL_RCPT#,,"UC4 load on &$SYSTEM# exceeded limit over last 10 minute average","Warning: load average over 10 minutes on &$SYSTEM# is currently &LOAD_10_FMT# (which may be benign, since the function to report the averages seems to be buggy ...")
:  IF &RETVAL# <> 0
:    PRINT "ERROR: Sending Email failed with code &RETVAL#!"
:  ENDIF
:ENDIF

:PRINT "System Monitor for &$SYSTEM#"
:PRINT "Version: &VER_INFO#"
:PRINT "Options: &SERVER_OPTS#"
:PRINT ""
:PRINT "Load (system) pct. (1m, 10m, 60m): &LOAD_01_FMT#, &LOAD_10_FMT#, &LOAD_60_FMT#"
:PRINT "Load (PWP MQ) pct. (1m, 10m, 60m): &MQ_PWP_BUSY_01_FMT#, &MQ_PWP_BUSY_10_FMT#, &MQ_PWP_BUSY_60_FMT#"
:PRINT ""
:PRINT "Message queues:"
:PRINT "Type |   Msg. Queued      |   Avg. Proc. Time    |  Descr.    "
:PRINT "-----------------------------------------------------------------------------------------"
:PRINT "PWP  |   &MQ_PWP_COUNT# |   &MQ_PWP_AVGTIME#   |  Primary WP"
:PRINT "WP   |   &MQ_WP_COUNT# |   &MQ_WP_AVGTIME#   |  Worker Process"
:PRINT "DWP  |   &MQ_DWP_COUNT# |   &MQ_DWP_AVGTIME#   |  Dialog WP"
:PRINT "OWP  |   &MQ_OWP_COUNT# |   &MQ_OWP_AVGTIME#   |  Output"
:PRINT "RWP  |   &MQ_RWP_COUNT# |   &MQ_RWP_AVGTIME#   |  Resources"
:PRINT ""

! check all server processes, report if one (or more) are considered dead
! should be changed to parsing an array later

:SET &SYS_SERVERS_DEAD#=""
:IF SYS_SERVER_ALIVE("UC4P#CP001") <> "Y"
:  SET &SYS_SERVERS_DEAD#="&SYS_SERVERS_DEAD# UC4P#CP001"
:  PRINT "Fehler in &SYS_SERVERS_DEAD#"
:ENDIF

:IF SYS_SERVER_ALIVE("UC4P#CP002") <> "Y"
:  SET &SYS_SERVERS_DEAD#="&SYS_SERVERS_DEAD# UC4P#CP002"
:  PRINT "Fehler in &SYS_SERVERS_DEAD#"
:ENDIF

:IF SYS_SERVER_ALIVE("UC4P#CP003") <> "Y"
:  SET &SYS_SERVERS_DEAD#="&SYS_SERVERS_DEAD# UC4P#CP003"
:  PRINT "Fehler in &SYS_SERVERS_DEAD#"
:ENDIF

:IF SYS_SERVER_ALIVE("UC4P#CP004") <> "Y"
:  SET &SYS_SERVERS_DEAD#="&SYS_SERVERS_DEAD# UC4P#CP004"
:  PRINT "Fehler in &SYS_SERVERS_DEAD#"
:ENDIF

:IF SYS_SERVER_ALIVE("UC4P#WP001") <> "Y"
:  SET &SYS_SERVERS_DEAD#="&SYS_SERVERS_DEAD# UC4P#WP001"
:  PRINT "Fehler in &SYS_SERVERS_DEAD#"
:ENDIF

:IF SYS_SERVER_ALIVE("UC4P#WP002") <> "Y"
:  SET &SYS_SERVERS_DEAD#="&SYS_SERVERS_DEAD# UC4P#WP002"
:  PRINT "Fehler in &SYS_SERVERS_DEAD#"
:ENDIF

:IF SYS_SERVER_ALIVE("UC4P#WP003") <> "Y"
:  SET &SYS_SERVERS_DEAD#="&SYS_SERVERS_DEAD# UC4P#WP003"
:  PRINT "Fehler in &SYS_SERVERS_DEAD#"
:ENDIF

:IF SYS_SERVER_ALIVE("UC4P#WP004") <> "Y"
:  SET &SYS_SERVERS_DEAD#="&SYS_SERVERS_DEAD# UC4P#WP004"
:  PRINT "Fehler in &SYS_SERVERS_DEAD#"
:ENDIF

:IF SYS_SERVER_ALIVE("UC4P#WP005") <> "Y"
:  SET &SYS_SERVERS_DEAD#="&SYS_SERVERS_DEAD# UC4P#WP005"
:  PRINT "Fehler in &SYS_SERVERS_DEAD#"
:ENDIF

:IF SYS_SERVER_ALIVE("UC4P#WP006") <> "Y"
:  SET &SYS_SERVERS_DEAD#="&SYS_SERVERS_DEAD# UC4P#WP006"
:  PRINT "Fehler in &SYS_SERVERS_DEAD#"
:ENDIF

:IF SYS_SERVER_ALIVE("UC4P#WP007") <> "Y"
:  SET &SYS_SERVERS_DEAD#="&SYS_SERVERS_DEAD# UC4P#WP007"
:  PRINT "Fehler in &SYS_SERVERS_DEAD#"
:ENDIF

:IF SYS_SERVER_ALIVE("UC4P#WP008") <> "Y"
:  SET &SYS_SERVERS_DEAD#="&SYS_SERVERS_DEAD# UC4P#WP008"
:  PRINT "Fehler in &SYS_SERVERS_DEAD#"
:ENDIF

:IF SYS_SERVER_ALIVE("UC4P#WP009") <> "Y"
:  SET &SYS_SERVERS_DEAD#="&SYS_SERVERS_DEAD# UC4P#WP009"
:  PRINT "Fehler in &SYS_SERVERS_DEAD#"
:ENDIF

:IF SYS_SERVER_ALIVE("UC4P#WP010") <> "Y"
:  SET &SYS_SERVERS_DEAD#="&SYS_SERVERS_DEAD# UC4P#WP010"
:  PRINT "Fehler in &SYS_SERVERS_DEAD#"
:ENDIF

:IF SYS_SERVER_ALIVE("UC4P#WP011") <> "Y"
:  SET &SYS_SERVERS_DEAD#="&SYS_SERVERS_DEAD# UC4P#WP011"
:  PRINT "Fehler in &SYS_SERVERS_DEAD#"
:ENDIF

:IF SYS_SERVER_ALIVE("UC4P#WP012") <> "Y"
:  SET &SYS_SERVERS_DEAD#="&SYS_SERVERS_DEAD# UC4P#WP012"
:  PRINT "Fehler in &SYS_SERVERS_DEAD#"
:ENDIF

:IF SYS_SERVER_ALIVE("UC4P#WP013") <> "Y"
:  SET &SYS_SERVERS_DEAD#="&SYS_SERVERS_DEAD# UC4P#WP013"
:  PRINT "Fehler in &SYS_SERVERS_DEAD#"
:ENDIF

:IF SYS_SERVER_ALIVE("UC4P#WP014") <> "Y"
:  SET &SYS_SERVERS_DEAD#="&SYS_SERVERS_DEAD# UC4P#WP014"
:  PRINT "Fehler in &SYS_SERVERS_DEAD#"
:ENDIF

:IF SYS_SERVER_ALIVE("UC4P#WP015") <> "Y"
:  SET &SYS_SERVERS_DEAD#="&SYS_SERVERS_DEAD# UC4P#WP015"
:  PRINT "Fehler in &SYS_SERVERS_DEAD#"
:ENDIF

:IF SYS_SERVER_ALIVE("UC4P#WP016") <> "Y"
:  SET &SYS_SERVERS_DEAD#="&SYS_SERVERS_DEAD# UC4P#WP016"
:  PRINT "Fehler in &SYS_SERVERS_DEAD#"
:ENDIF

:IF SYS_SERVER_ALIVE("UC4P#WP017") <> "Y"
:  SET &SYS_SERVERS_DEAD#="&SYS_SERVERS_DEAD# UC4P#WP017"
:  PRINT "Fehler in &SYS_SERVERS_DEAD#"
:ENDIF

:IF SYS_SERVER_ALIVE("UC4P#WP018") <> "Y"
:  SET &SYS_SERVERS_DEAD#="&SYS_SERVERS_DEAD# UC4P#WP018"
:  PRINT "Fehler in &SYS_SERVERS_DEAD#"
:ENDIF

:IF SYS_SERVER_ALIVE("UC4P#WP019") <> "Y"
:  SET &SYS_SERVERS_DEAD#="&SYS_SERVERS_DEAD# UC4P#WP019"
:  PRINT "Fehler in &SYS_SERVERS_DEAD#"
:ENDIF

:IF SYS_SERVER_ALIVE("UC4P#WP020") <> "Y"
:  SET &SYS_SERVERS_DEAD#="&SYS_SERVERS_DEAD# UC4P#WP020"
:  PRINT "Fehler in &SYS_SERVERS_DEAD#"
:ENDIF

:IF &SYS_SERVERS_DEAD# <> ""
!  only send an email if something is a) wrong and b) has changed since last email
:  SET &LAST_DEADPROCESS_LIST# = GET_VAR(&STATEVAR_NAME#, "LAST_DEADPROCESS_LIST")
:  IF &SYS_SERVERS_DEAD# <> &LAST_DEADPROCESS_LIST#
:    PRINT "The following processes are reportedly DEAD: &SYS_SERVERS_DEAD#"
:    SET &RETVAL# = SEND_MAIL(&MAIL_RCPT#,,"Dead Process on &$SYSTEM#","The following server processes are reported DEAD by the server monitoring script: &SYS_SERVERS_DEAD#. You will NOT receive further emails unless the list of dead processes changes!")
:    IF &RETVAL# <> 0
:      PRINT "ERROR: Sending Email failed with code &RETVAL#!"
:    ELSE
!      only set "acknowledgement" in variable if email sending worked. Otherwise, keep attempting to send mails in case it's a temporary problem.
:      PUT_VAR &STATEVAR_NAME#,"LAST_DEADPROCESS_LIST", &SYS_SERVERS_DEAD#
:    ENDIF
:  ENDIF
:ELSE
:  print "All server processes reportedly alive."
:ENDIF

! ----------- no shell script above this line

set -e

COLLATE_DIR=/tmp/uc4_servmon_counters

mkdir -p $COLLATE_DIR

# put data into files so Zabbix can farm it later

echo "&LOAD_01_FMT#" | bc        > $COLLATE_DIR/uc4_sys_load_1min.txt
echo "&MQ_PWP_BUSY_01_FMT#" | bc > $COLLATE_DIR/uc4_mq_pwp_busy_1min.txt
echo "&MQ_PWP_COUNT#"   | bc     > $COLLATE_DIR/uc4_mq_pwp_count_cur.txt
echo "&MQ_WP_COUNT#"    | bc     > $COLLATE_DIR/uc4_mq_wp_count_cur.txt
echo "&MQ_DWP_COUNT#"   | bc     > $COLLATE_DIR/uc4_mq_dwp_count_cur.txt
echo "&MQ_OWP_COUNT#"   | bc     > $COLLATE_DIR/uc4_mq_owp_count_cur.txt
echo "&MQ_RWP_COUNT#"   | bc     > $COLLATE_DIR/uc4_mq_rwp_count_cur.txt
echo "&MQ_PWP_AVGTIME#" | bc     > $COLLATE_DIR/uc4_mq_pwp_avgproctime.txt
echo "&MQ_WP_AVGTIME#"  | bc     > $COLLATE_DIR/uc4_mq_wp_avgproctime.txt
echo "&MQ_DWP_AVGTIME#" | bc     > $COLLATE_DIR/uc4_mq_dwp_avgproctime.txt
echo "&MQ_OWP_AVGTIME#" | bc     > $COLLATE_DIR/uc4_mq_owp_avgproctime.txt
echo "&MQ_RWP_AVGTIME#" | bc     > $COLLATE_DIR/uc4_mq_rwp_avgproctime.txt

SERVER_PROCESSES_NOT_OK="&SYS_SERVERS_DEAD#"

if [ ! -z "$SERVER_PROCESSES_NOT_OK" ] ; then
  NUM_SERVER_PROCESSES_NOT_OK=$( echo "$SERVER_PROCESSES_NOT_OK" | wc -w )
  echo $NUM_SERVER_PROCESSES_NOT_OK > $COLLATE_DIR/uc4_sys_server_procs_not_ok.txt
else
  echo "0" > $COLLATE_DIR/uc4_sys_server_procs_not_ok.txt
fi
This also prints a mildly human-readable report like this:
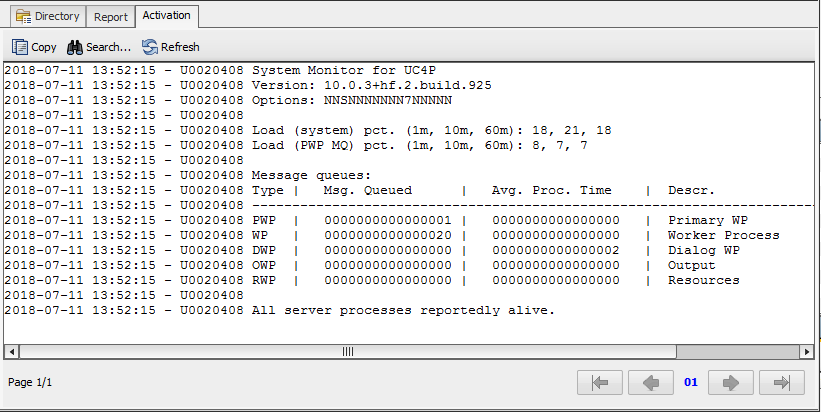
It's mildly entertaining that the queue numbers from inside Automic never seem to match those gotten from the actual DB tables, but it's usually not enough difference to truly matter.
Here's an example of how the data looks in Zabbix after it's been processed into a pile of widgets: