I will answer in full in the case (Will add the full reports). But for short - I suspect that you have too many packets coming in.
If you look at the Percentile Display:
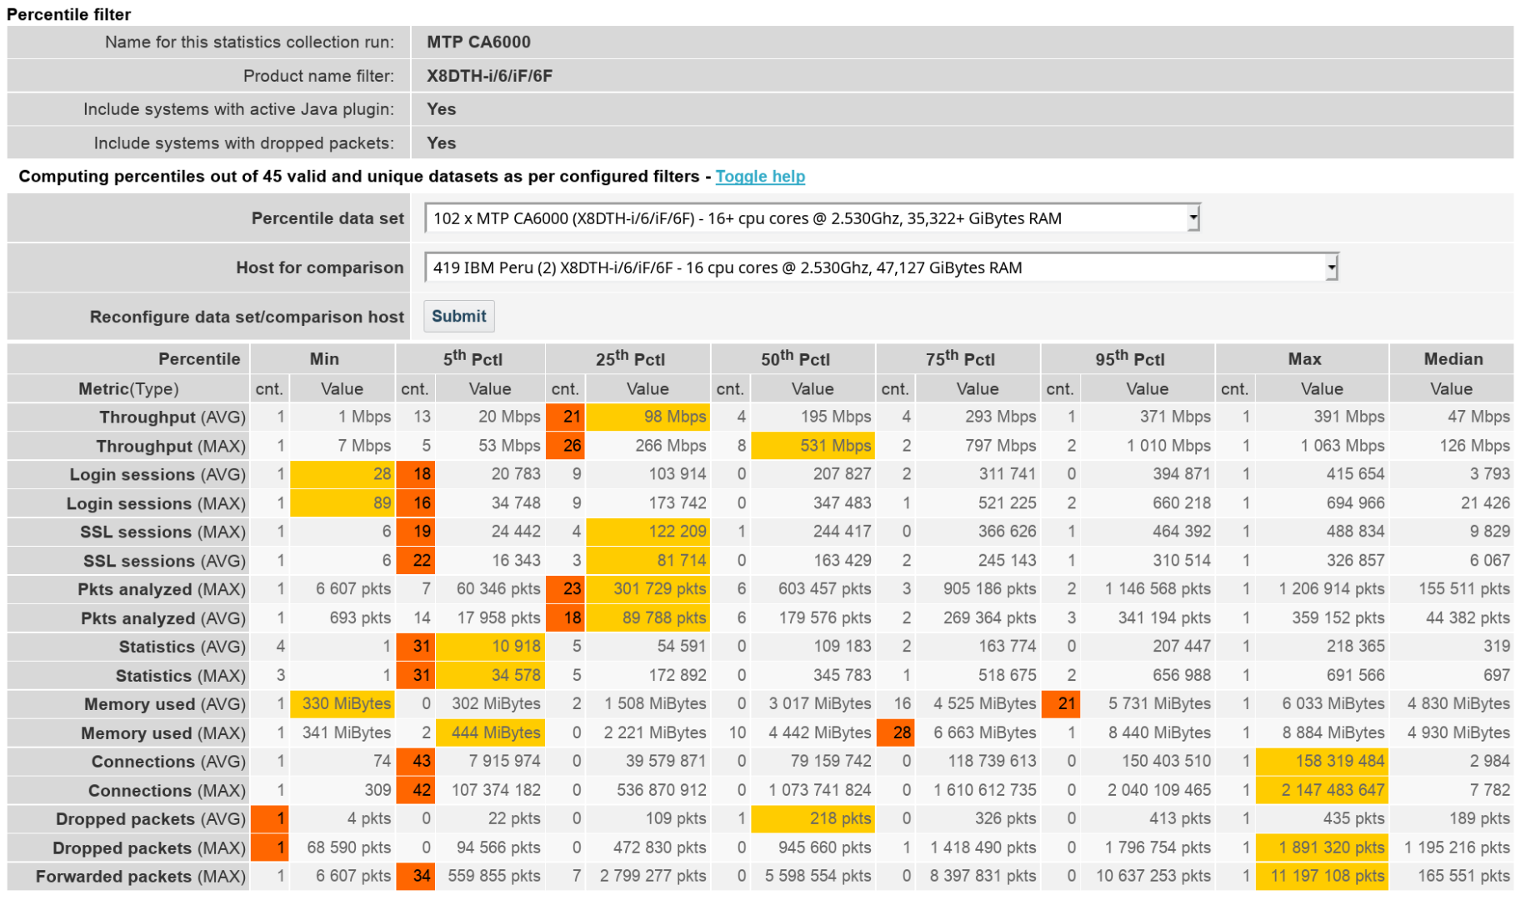
You can see that you not only have the max-number of connections, but also the max number of Packets forwarded to an MTP over a 1Gbps connection. Red is the nr. of "Host for comparison" in that percentile window, Orange is Your MTP.
This results in the TIMs not being able to actually handle the load if the filters are not set right. Small requests (especially SOAP/XML) can bring down an MTP with as little *** 20Mbps of traffic.
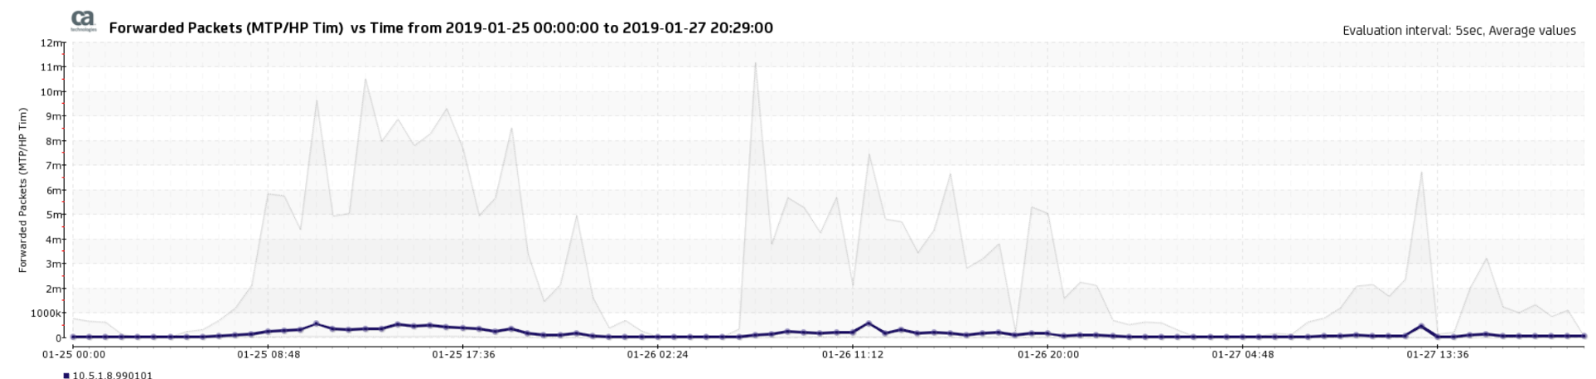
What happens is that the MTP forwards the traffic to the TIM Workers:
The CPU load will spike:
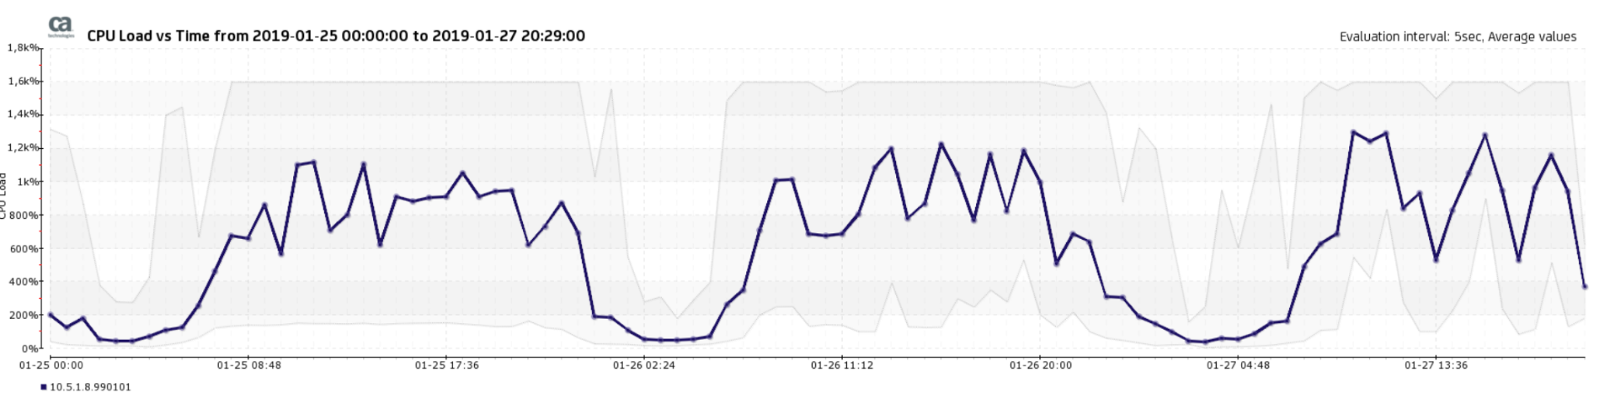
And you see the gray (shows the max load of the CPU's - here 1600% - as 16CPUs on the MTP, 100% per CPU Core), and the TIMs can't follow. They either crash, or are too slow to free the buffer filesystem. The ram-file system which serves as buffer on the MTP will fill up, and the nqcap-daemon can't write new data to that filesystem:
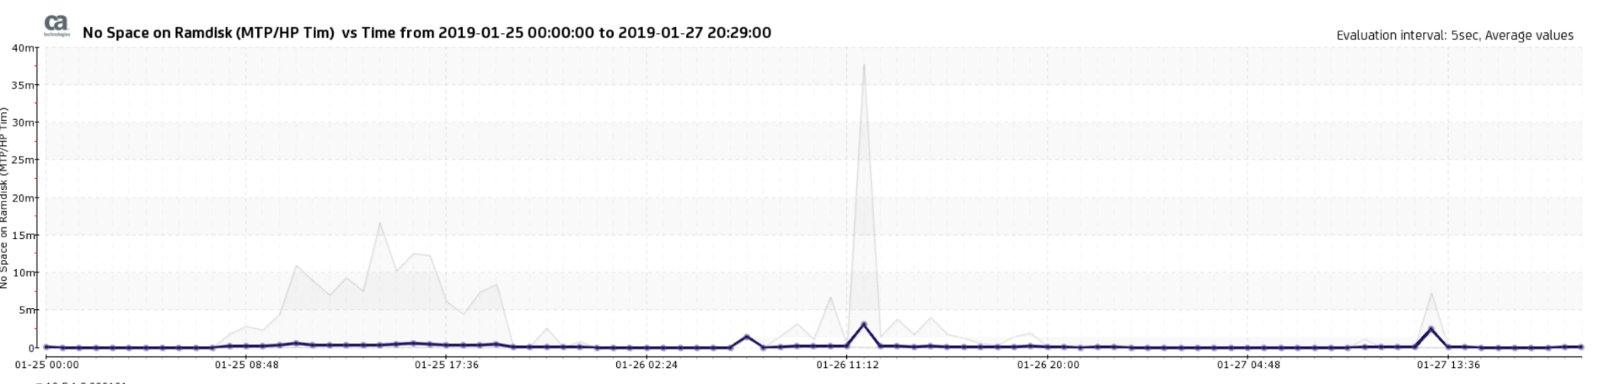
These packets will be discarded and dropped. And the TIM process itself will not see it.
With time, the TIMs will process old data, and eventually only receive partial data - which when it is encrypted, is really a matter of chance to have the complete communication flow & IKE parameters.
So - IMHO - if you see very few valid transactions, I am not surprised.
What you can do here, is fine tune the filters, so that the MTP is receiving only the traffic it is supposed to monitor, and nothing else -> hardware filters on the Napatech board. Not the CEM WebServer filters - as this is too late as the packets have hit the MTP already.